We Put Iris and Snowflake Cortex Analyst Head-to-Head. Here's What We Found.
April 20, 2026
A real-world evaluation on setup time, training effort, and accuracy on unpredictable business questions.
Introduction
The promise of AI-powered analytics has always been the same: let anyone ask questions about data and get real answers. No SQL, no waiting on a data analyst, no stale dashboards. It sounds simple. But anyone who has tried to deploy one of these tools knows the gap between demo and reality can be wide.
To put this to the test, we built a realistic airline operations dataset and ran the same questions through both Iris and Snowflake Cortex Analyst.
We evaluated them on two dimensions: accuracy and latency on real business questions.
The Test Setup
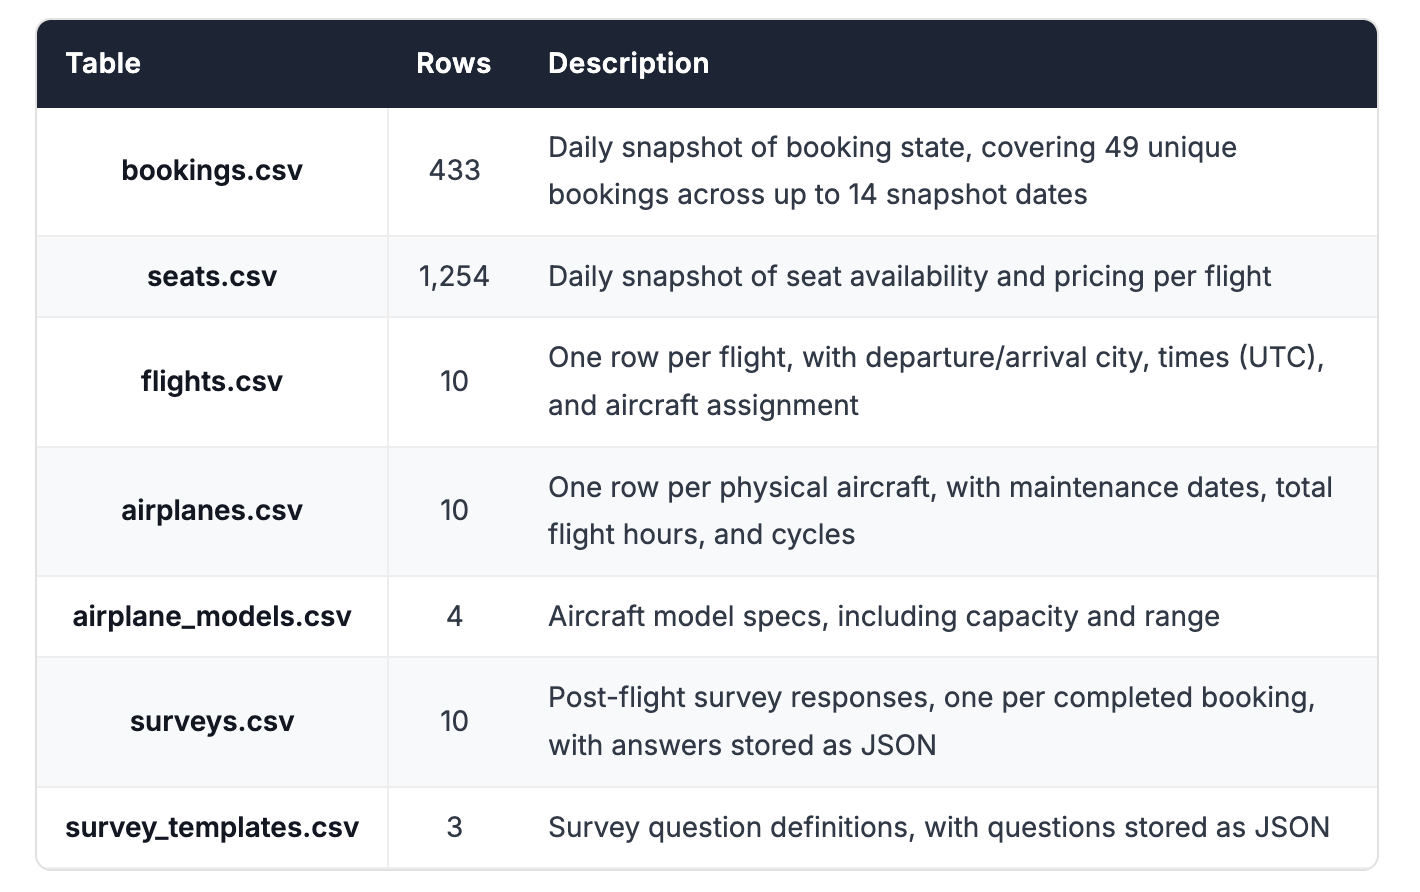
To run a fair, real-world comparison, we constructed an airline operations dataset modeled on complexities we see across real-world customer schemas: poorly named columns and tables, historical snapshot tables, JSON columns, complex multi-table joins, and more. The dataset spans 7 tables covering the core of an airline's business: bookings, flights, aircraft, seat availability, and post-flight passenger surveys.
A few things make this dataset genuinely challenging. Bookings and seat availability use a daily snapshot pattern: the same record appears multiple times over time, and queries need to account for that. Most meaningful questions require joining across multiple tables. Survey data is stored in JSON columns. These are not edge cases. They're the kinds of patterns that show up constantly in real production environments.
Data is rarely the core focus of a business user's job. They're asking questions in passing, between other priorities, and they shouldn't need the precision of a data analyst to get a good answer. A smart tool needs to understand the nuance in how a question is phrased and flag ambiguity rather than silently pick the wrong interpretation.
We ran both tools through the same three-phase process that mirrors how these products actually get deployed:
- Load the data into each tool.
- Train the product until it performs accurately on a set of diagnostic questions, reflecting how data analysts have told us they typically train these tools before rollout.
- Deploy and evaluate by asking a broader set of real-world business questions.
This structure reflects a constraint every team runs into. Given enough training time, most products can reach high accuracy on questions they've been prepared for. The problem is that analysts can't predict every question a business user might ask, and they don't have unlimited time to keep training. What matters is how well each tool performs in step three: on questions it wasn't explicitly trained for, with a realistic amount of upfront investment in step two.
That's what we set out to measure. Further details about the dataset, the exact procedure, the diagnostic questions, and the real-world questions can be found in the Appendix.
The Benchmark
Data Loading
We loaded the same 7-table dataset into both tools: same schema, same data. Both Iris and Snowflake Cortex Analyst offer extensive customization options for analysts: custom join definitions, table and column descriptions, semantic overrides, and more. In practice, we've found that these deep configurations add significant friction to the deployment process and make the product harder to hand off to the business. Based on what we see in real deployments, most teams don't use them extensively. To keep the comparison fair and realistic, we skipped them entirely and trained both products until we got 100% accuracy on the diagnostic questions.
Snowflake Cortex Analyst
Loading the dataset into Snowflake Cortex Analyst required uploading all 7 CSVs individually. There is no bulk import, so each table had to be loaded one at a time. For each upload, Snowflake presents a schema review step where you can verify and correct the inferred column types before committing. The schema was inferred correctly every time, so no corrections were needed.
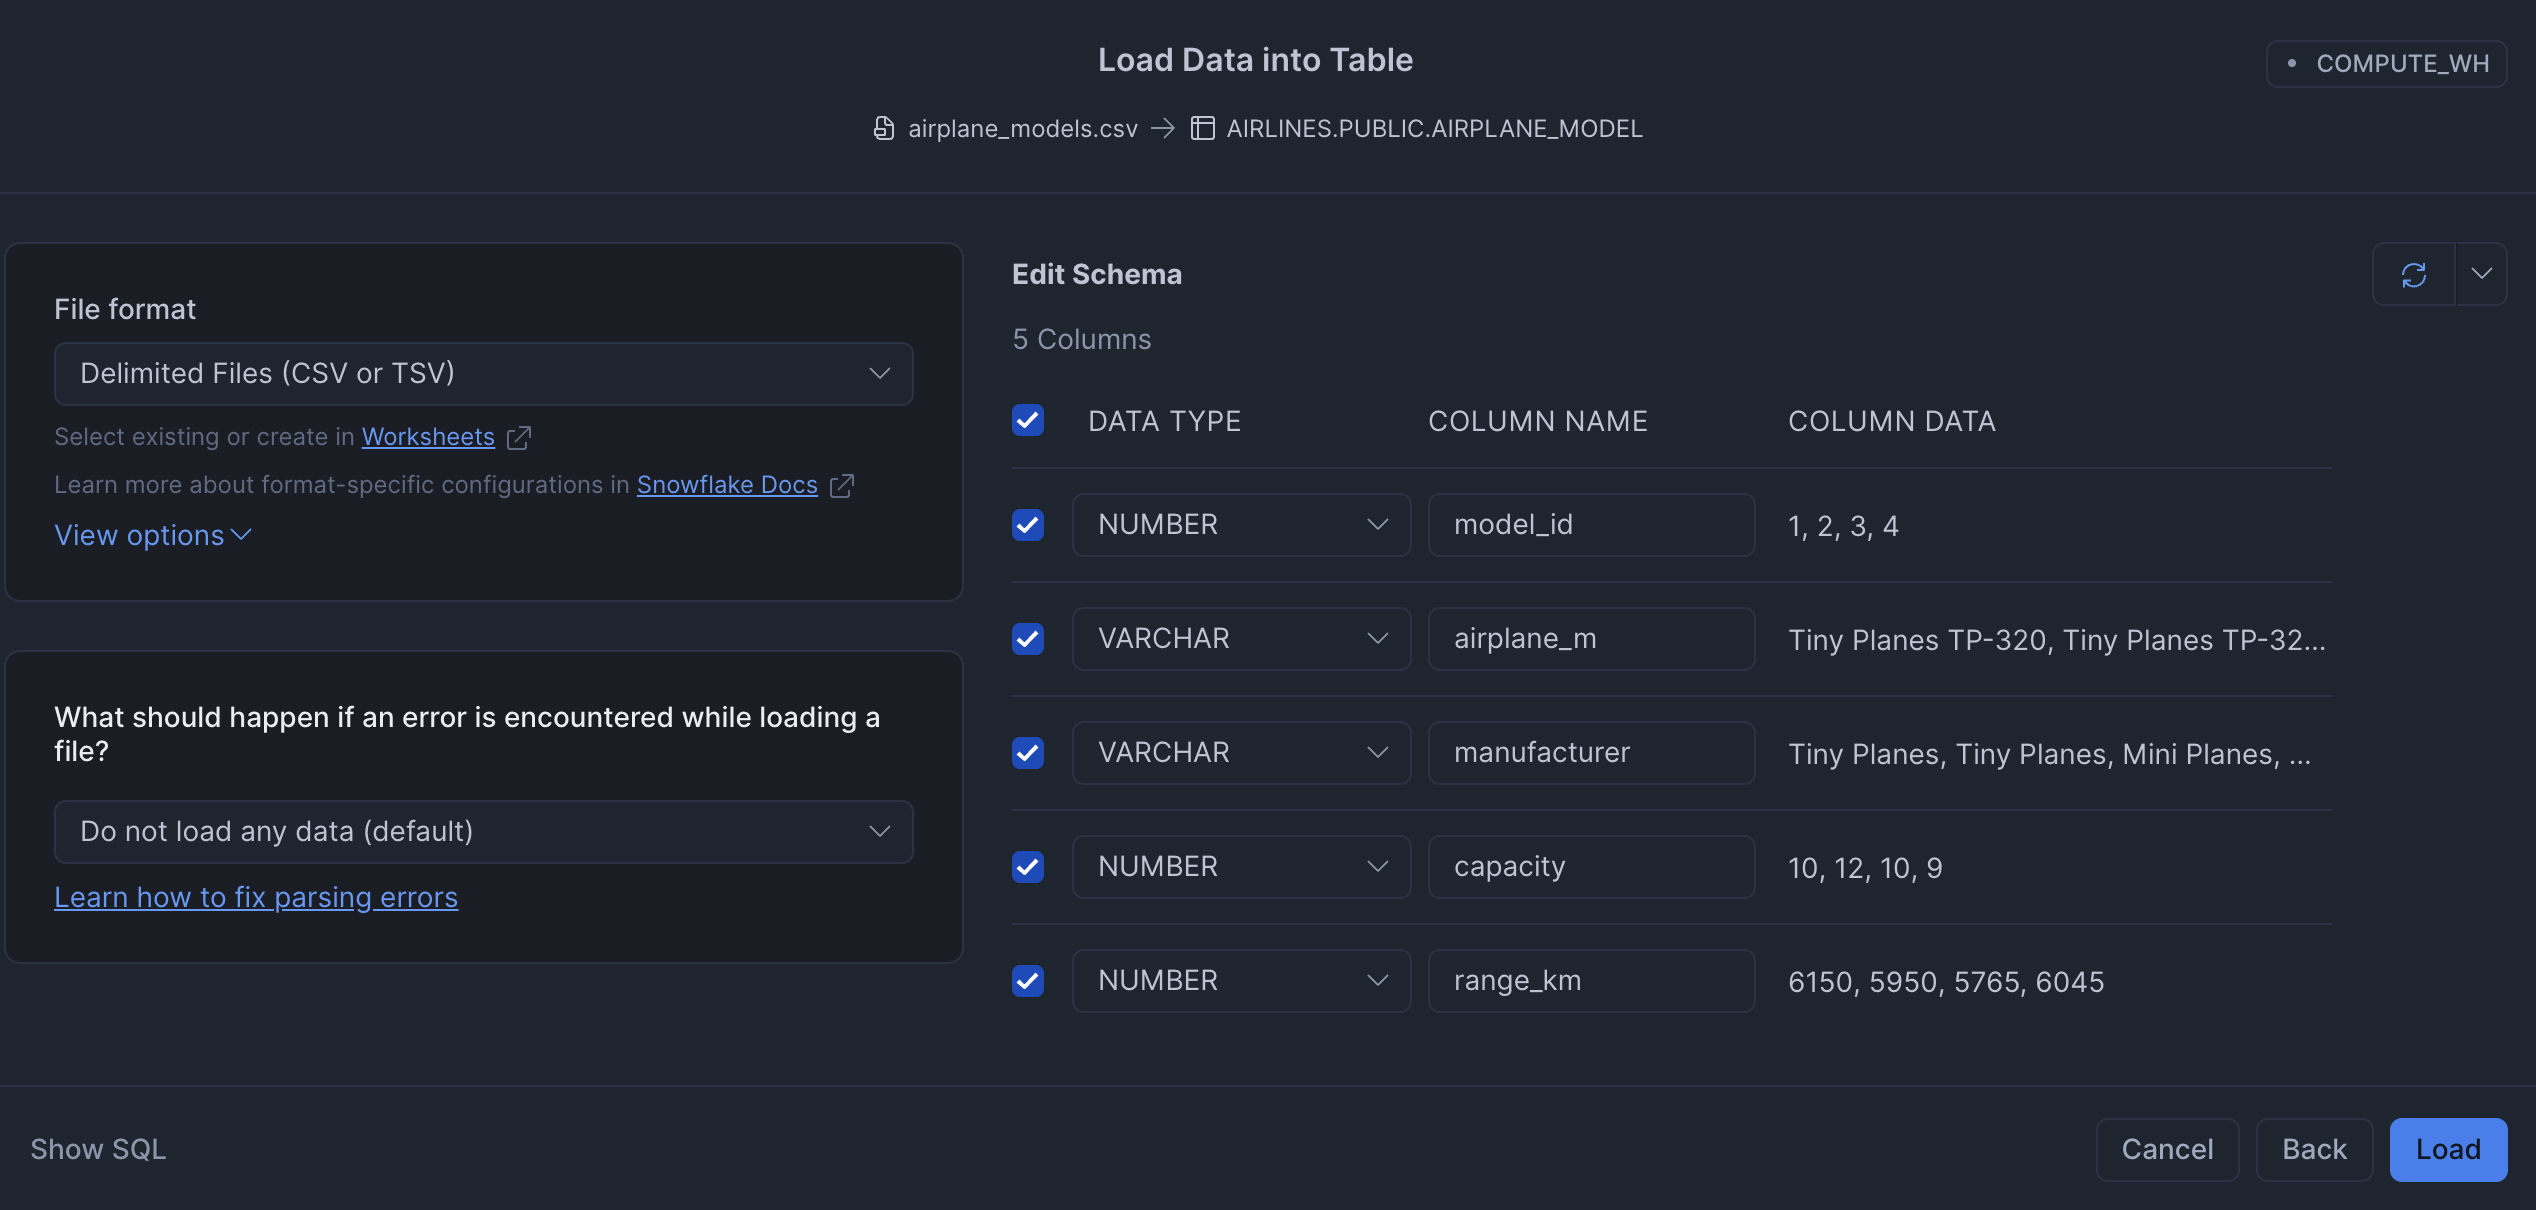
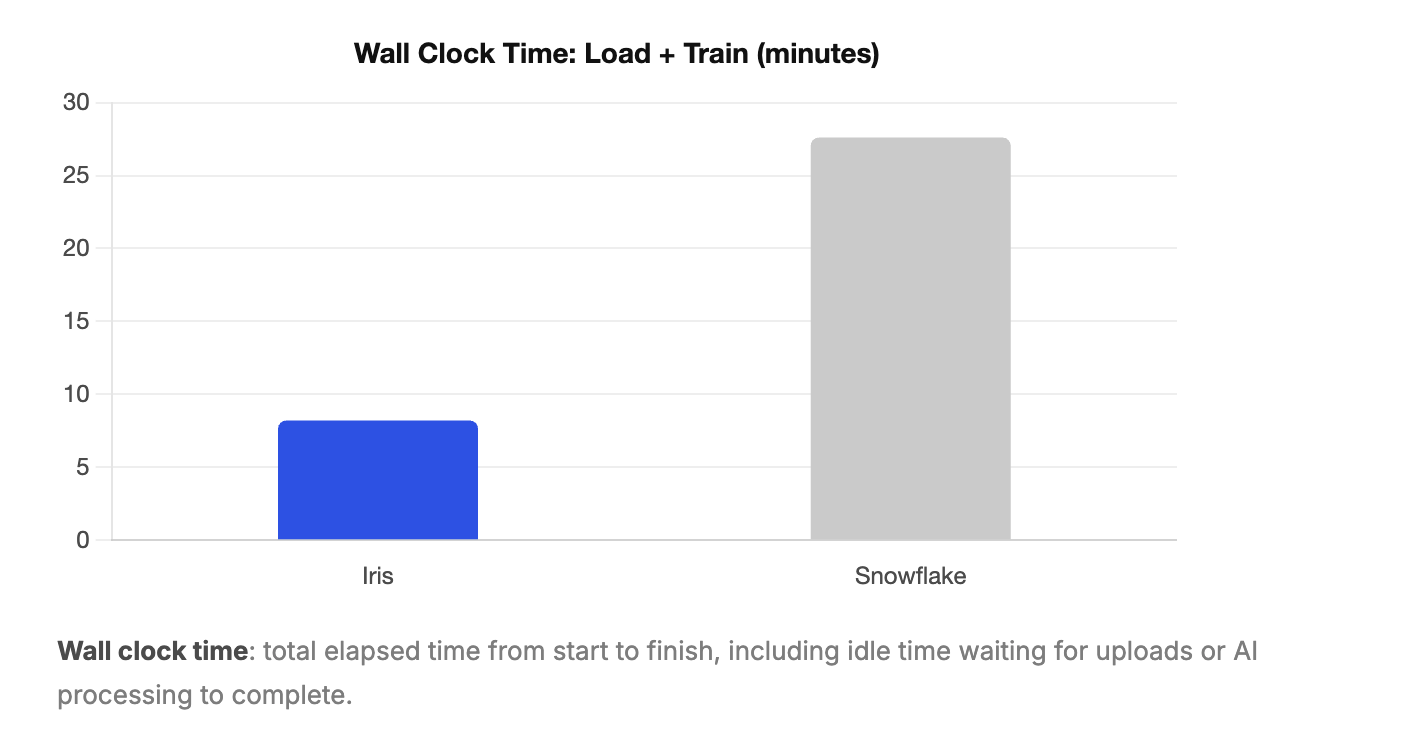
This took 3 min 40 sec of active user time and 3 min 45 sec of wall clock time. The near-identical figures reflect that the process required sustained manual effort with little idle waiting time.
Iris
Loading data into Iris was a single action. We dragged and dropped all 7 files at once and uploaded them.
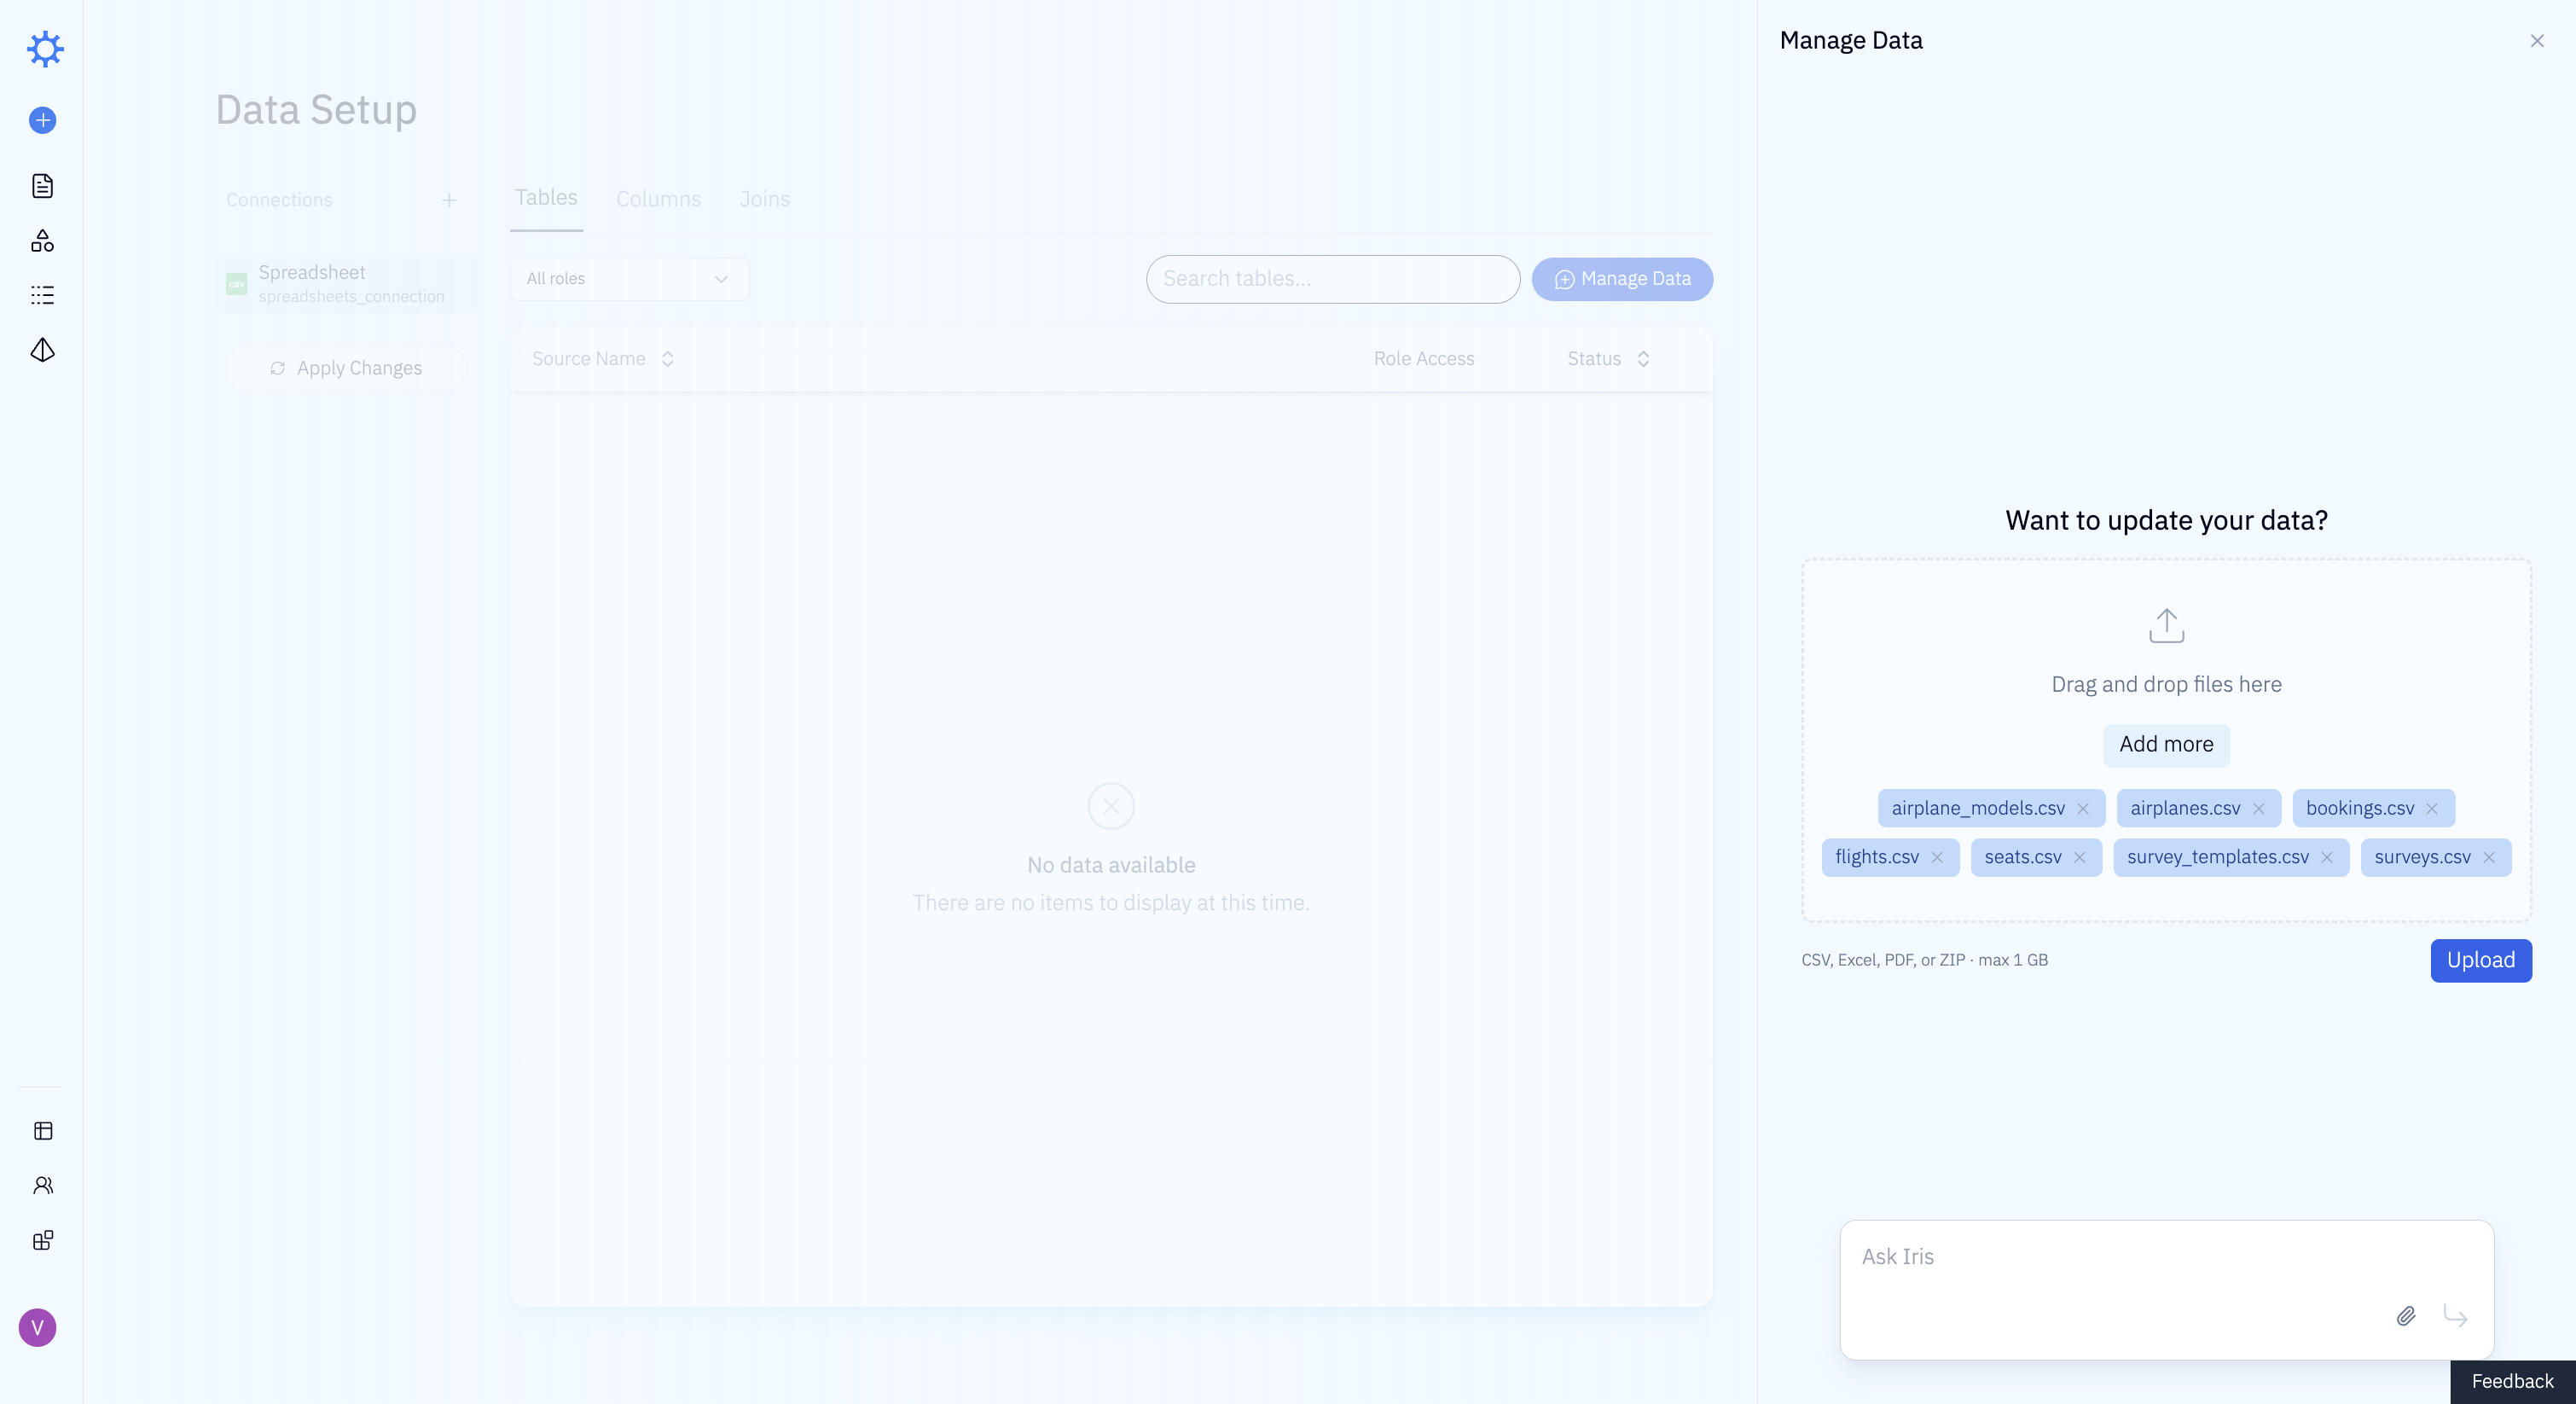
Iris analyzed the schema and proposed a loading plan, and we accepted it. No stepping through tables one by one, no type corrections.
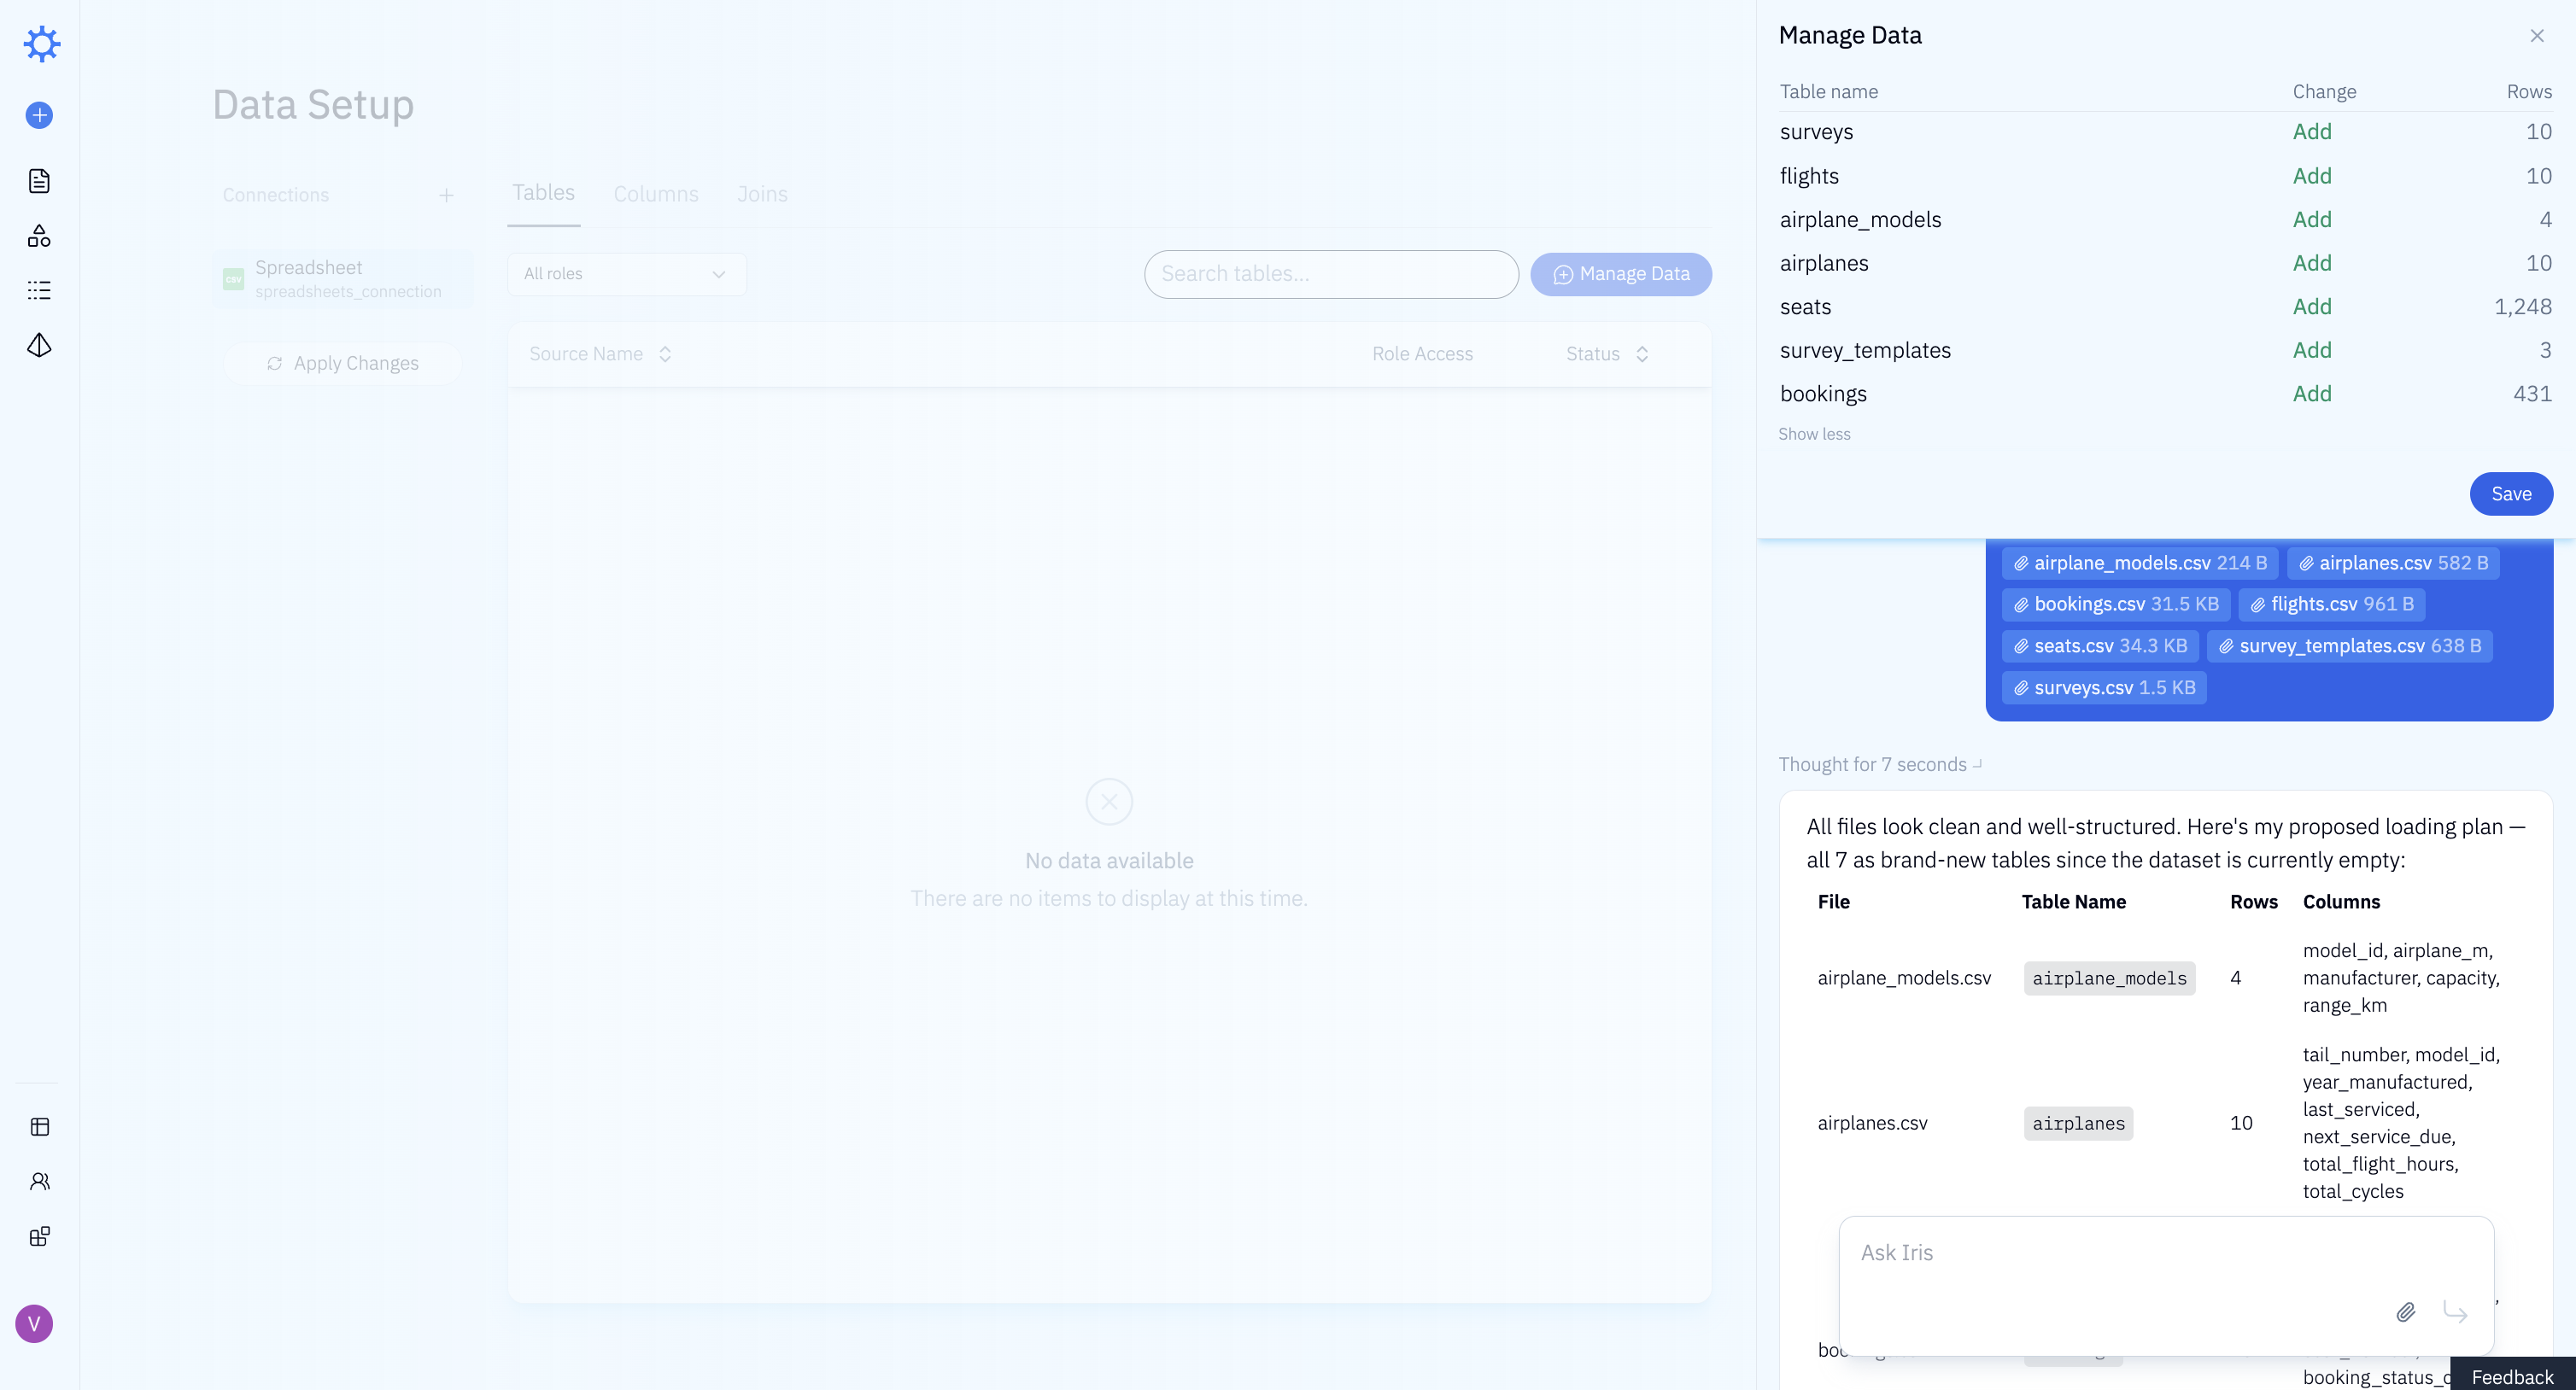
Loading the dataset into Iris took 1 min 20 sec of active user time and 3 min 30 sec of wall clock time. The difference reflects time spent waiting for uploads to complete and for the LLM to process the schema, not additional work required from the analyst.
Training
We trained each tool using the same set of diagnostic questions. These are simple, unambiguous questions with clear expected answers, the kind a data analyst would use to verify the tool understands the schema before handing it off to business users. Training continued until each tool answered all diagnostic questions correctly. We tracked how long this took and what kind of effort it required.
Snowflake Cortex Analyst
Training Snowflake Cortex Analyst involved a setup chain that only became clear as we worked through it. To create an agent, Snowflake requires you to first create a Cortex Analyst. To create a Cortex Analyst, Snowflake requires you to first create a Semantic View. So before configuring anything user-facing, we had to work backwards through the full dependency chain.
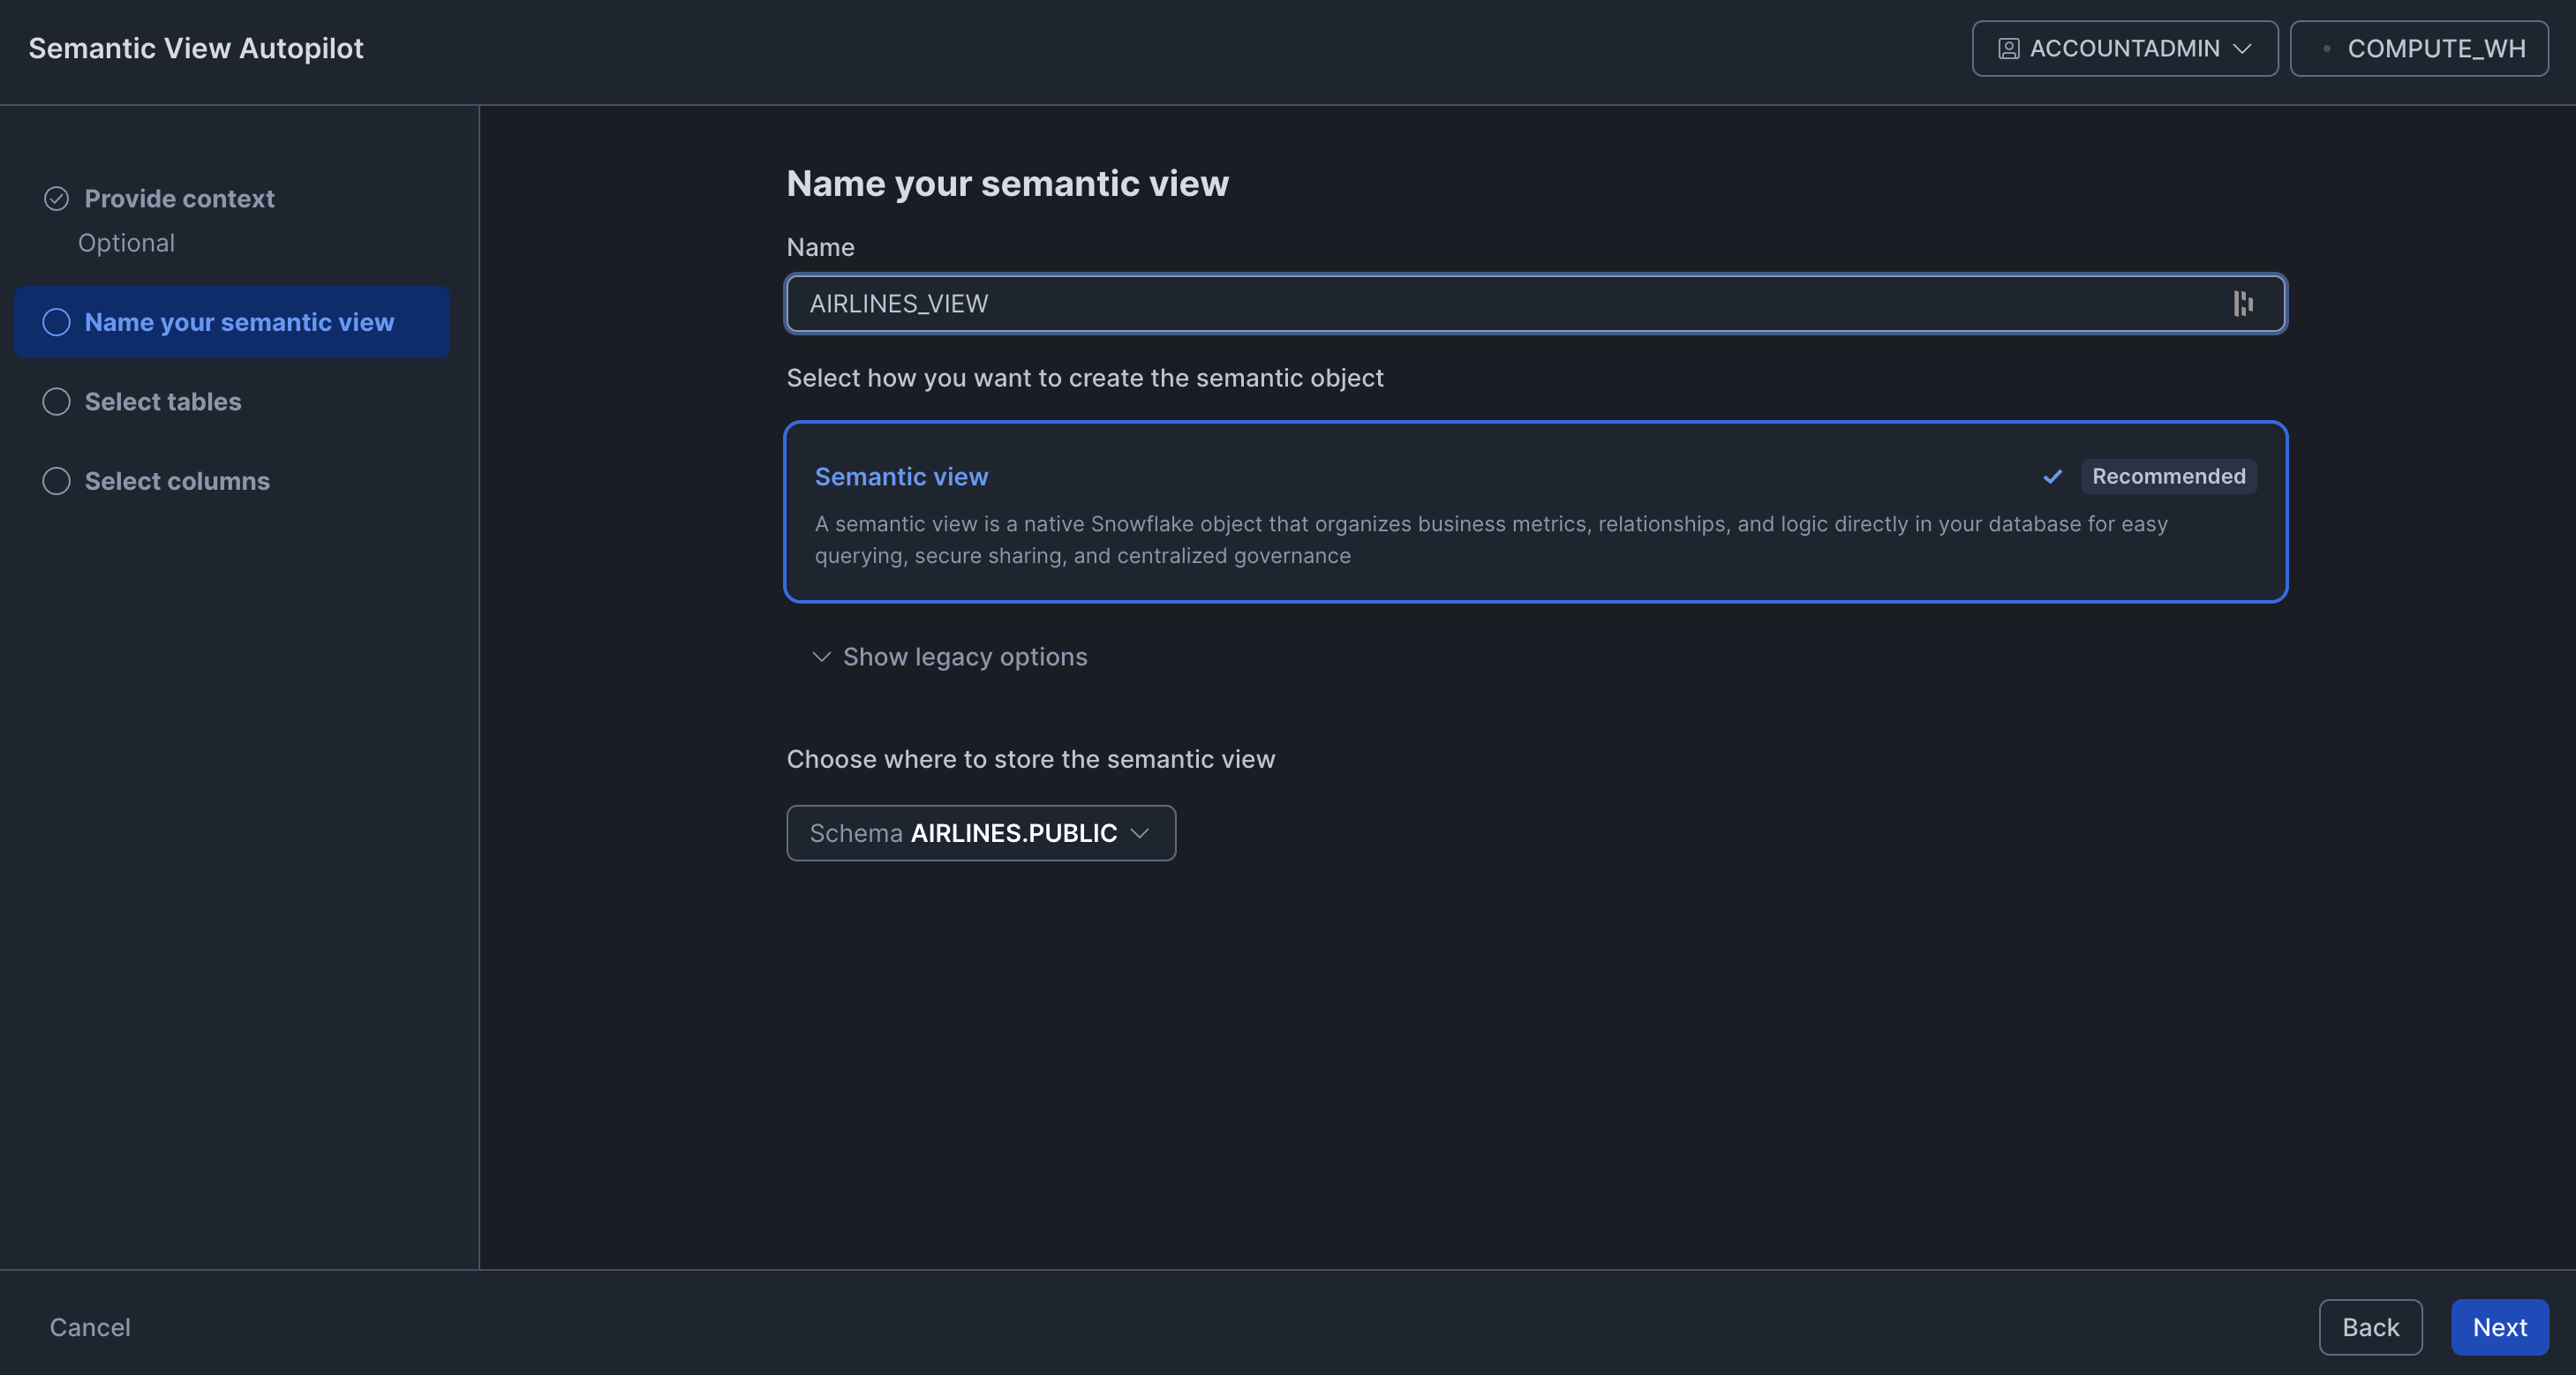
A Semantic View is a structured definition of the data that the Analyst uses to understand and query the schema. Snowflake has a Semantic View Autopilot that auto-generates one from your schema, which we hoped would make this step straightforward.
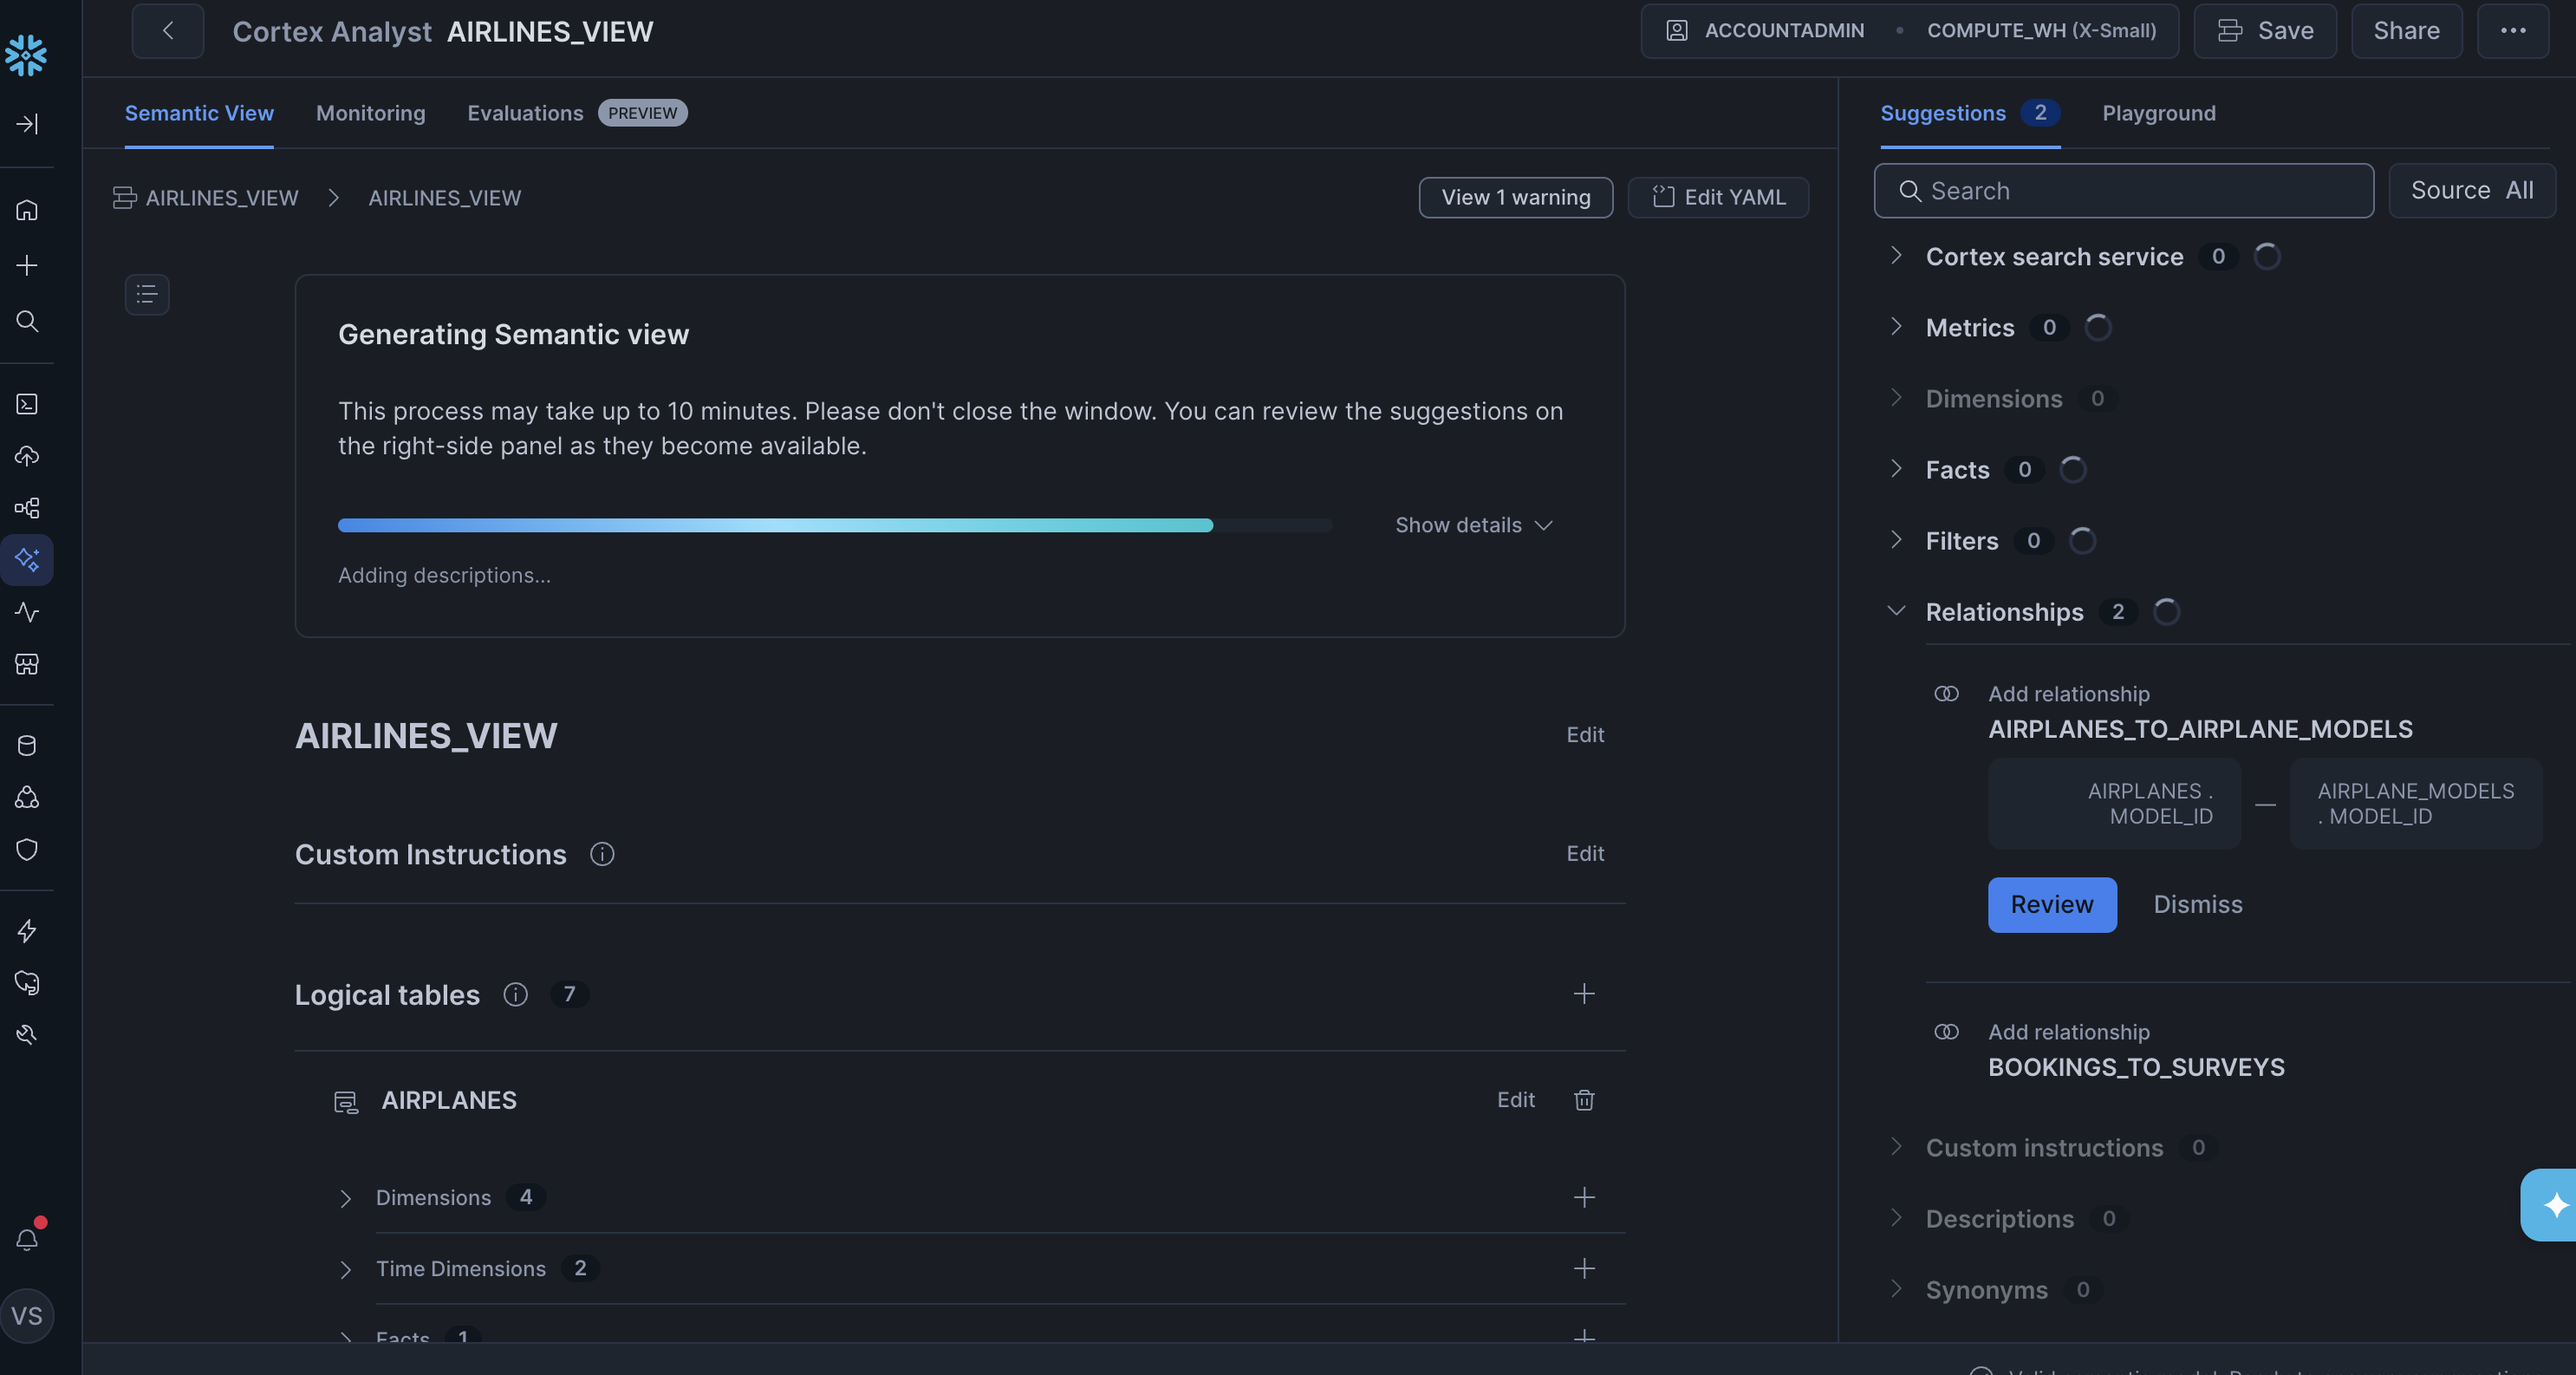
After the Autopilot finished, though, it was clear the output needed a lot of work. Many of the generated metrics were wrong. The most obvious issue was with the snapshot tables: the total_bookings metric on the bookings table was defined as COUNT(booking_id) with no snapshot filtering. Since the same booking appears once per day in the snapshot table, this would overcount every booking by up to 14x. The booked_seat_count metric on the seats table had the same problem — a bare SUM with no deduplication on snapshot_date. Fixing all of these manually would have been substantial work.
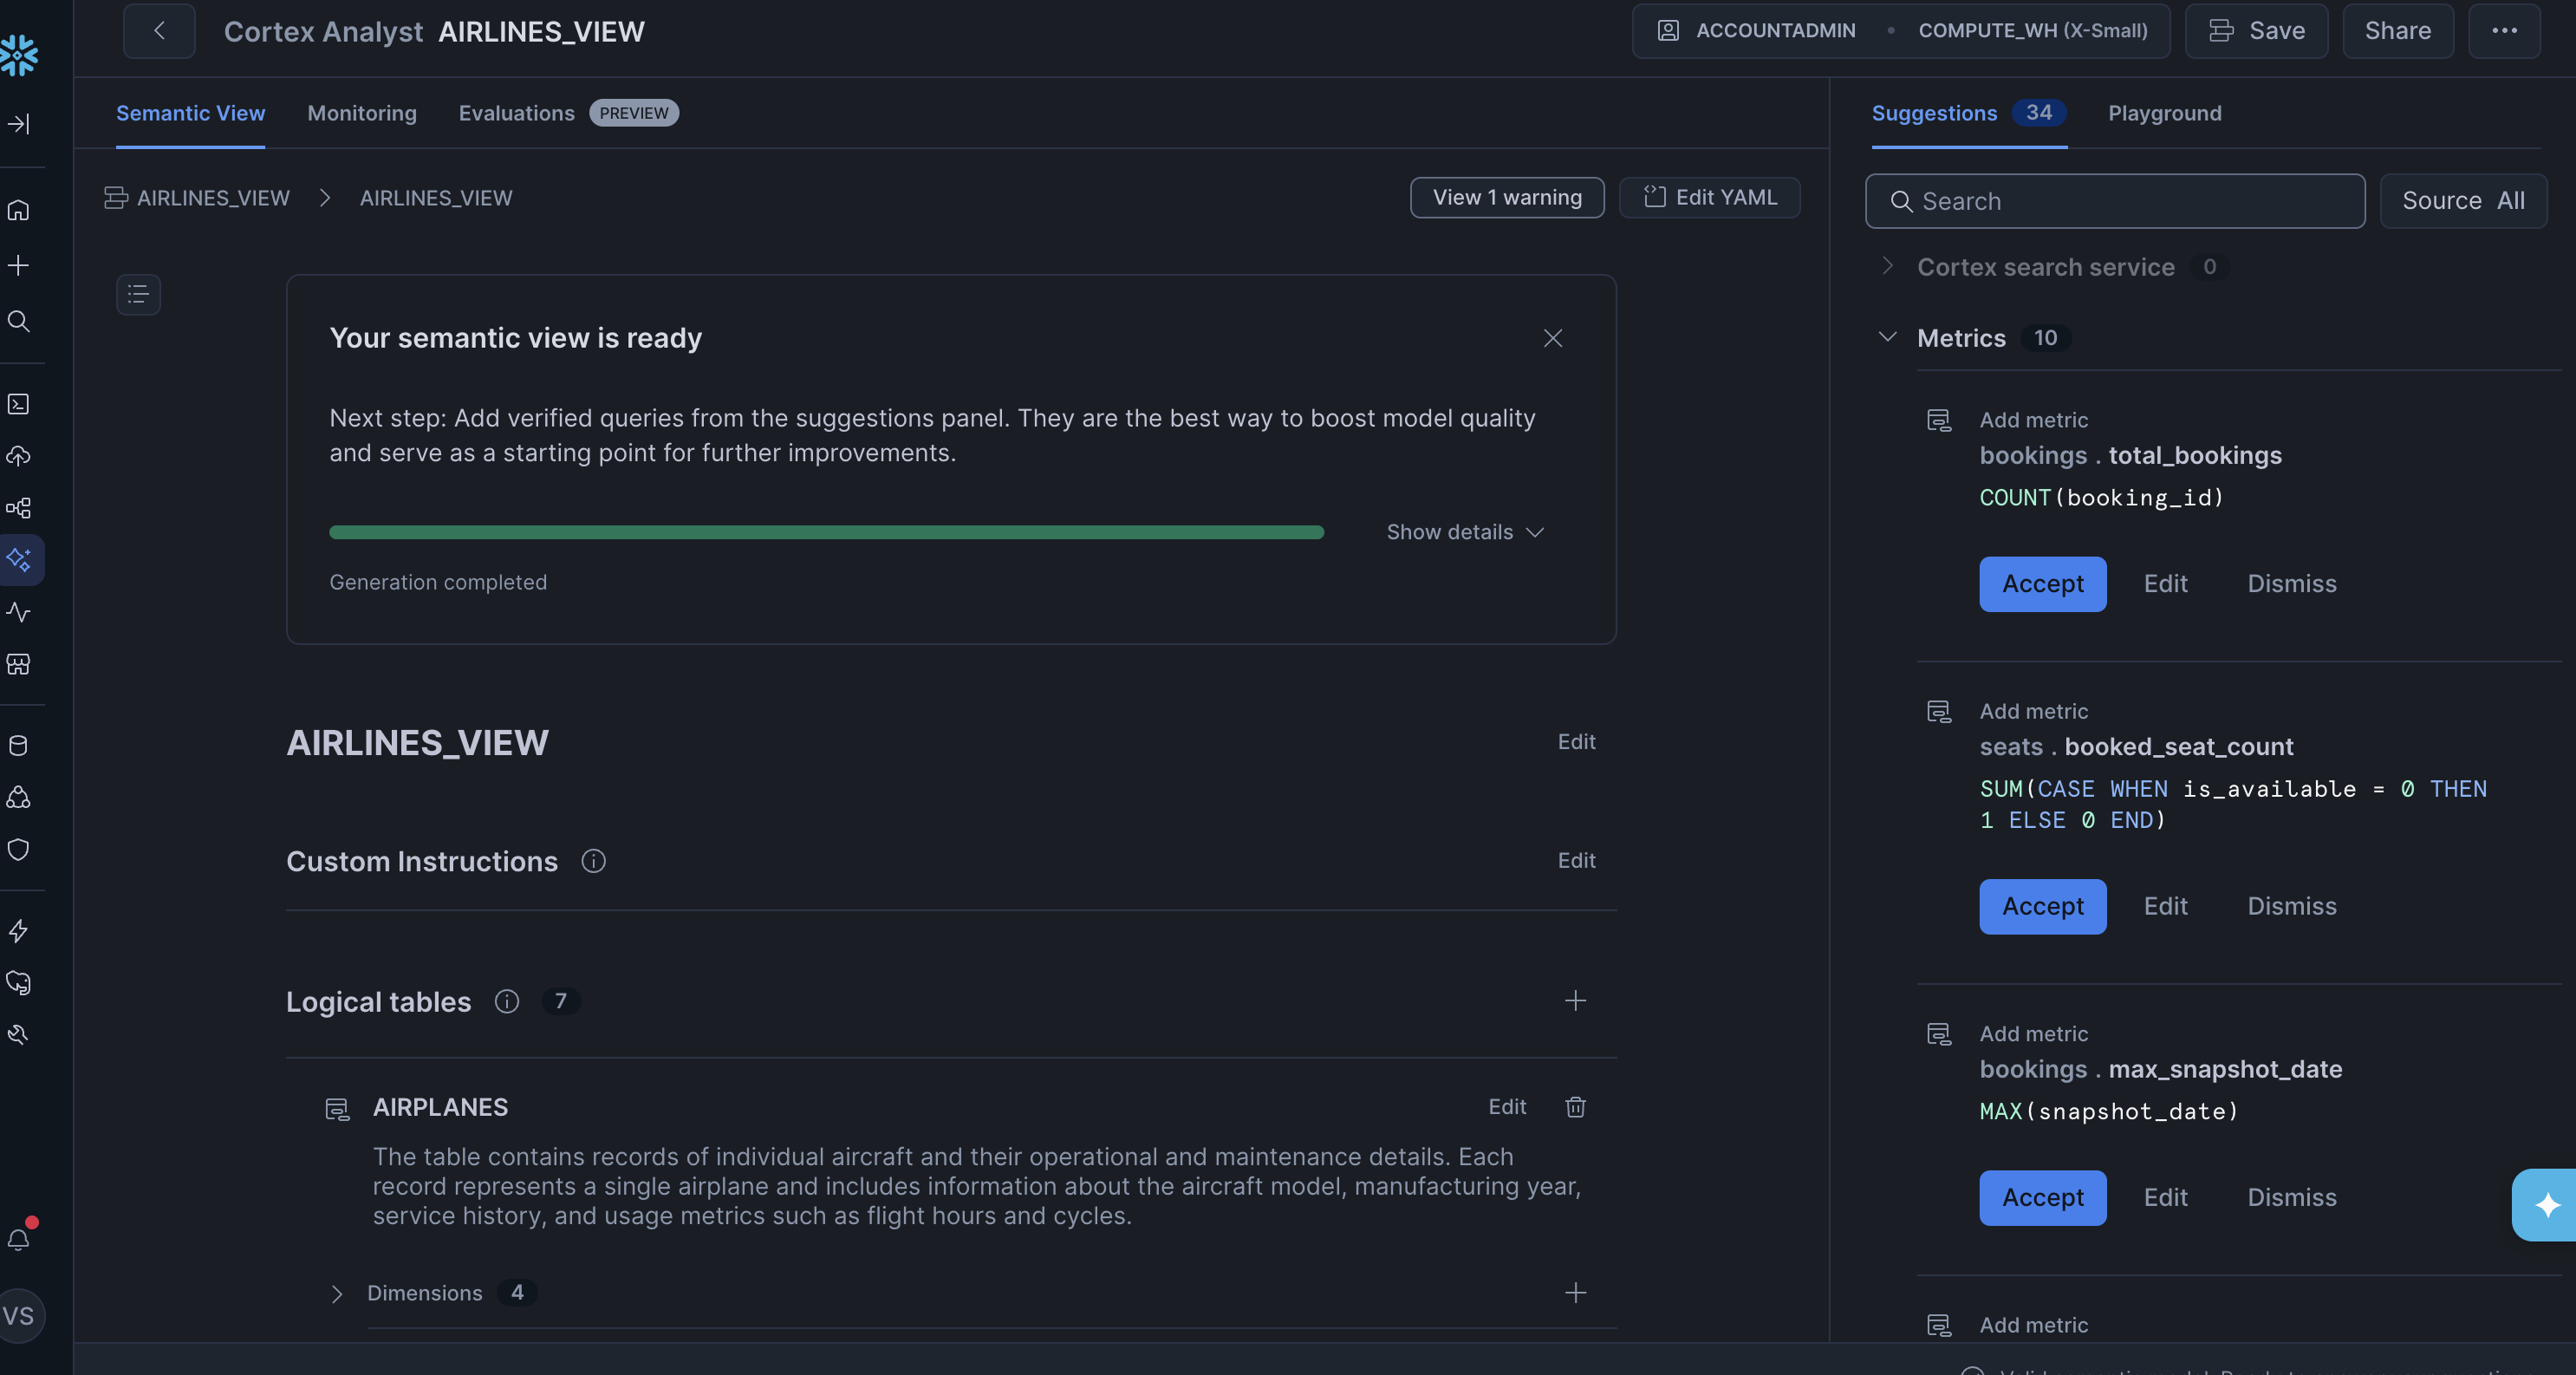
Instead, we used Snowflake's Cortex AI Assistant to regenerate the view: we pasted in the contents of our dataset README with the prompt "Please update your metrics / dimensions using the information in this readme. Please ensure you extract all the information." The assistant produced a much better result, though it still missed some details about the snapshot tables, so we iterated further to fix those.

With the Semantic View in place, we could finally create the agent.
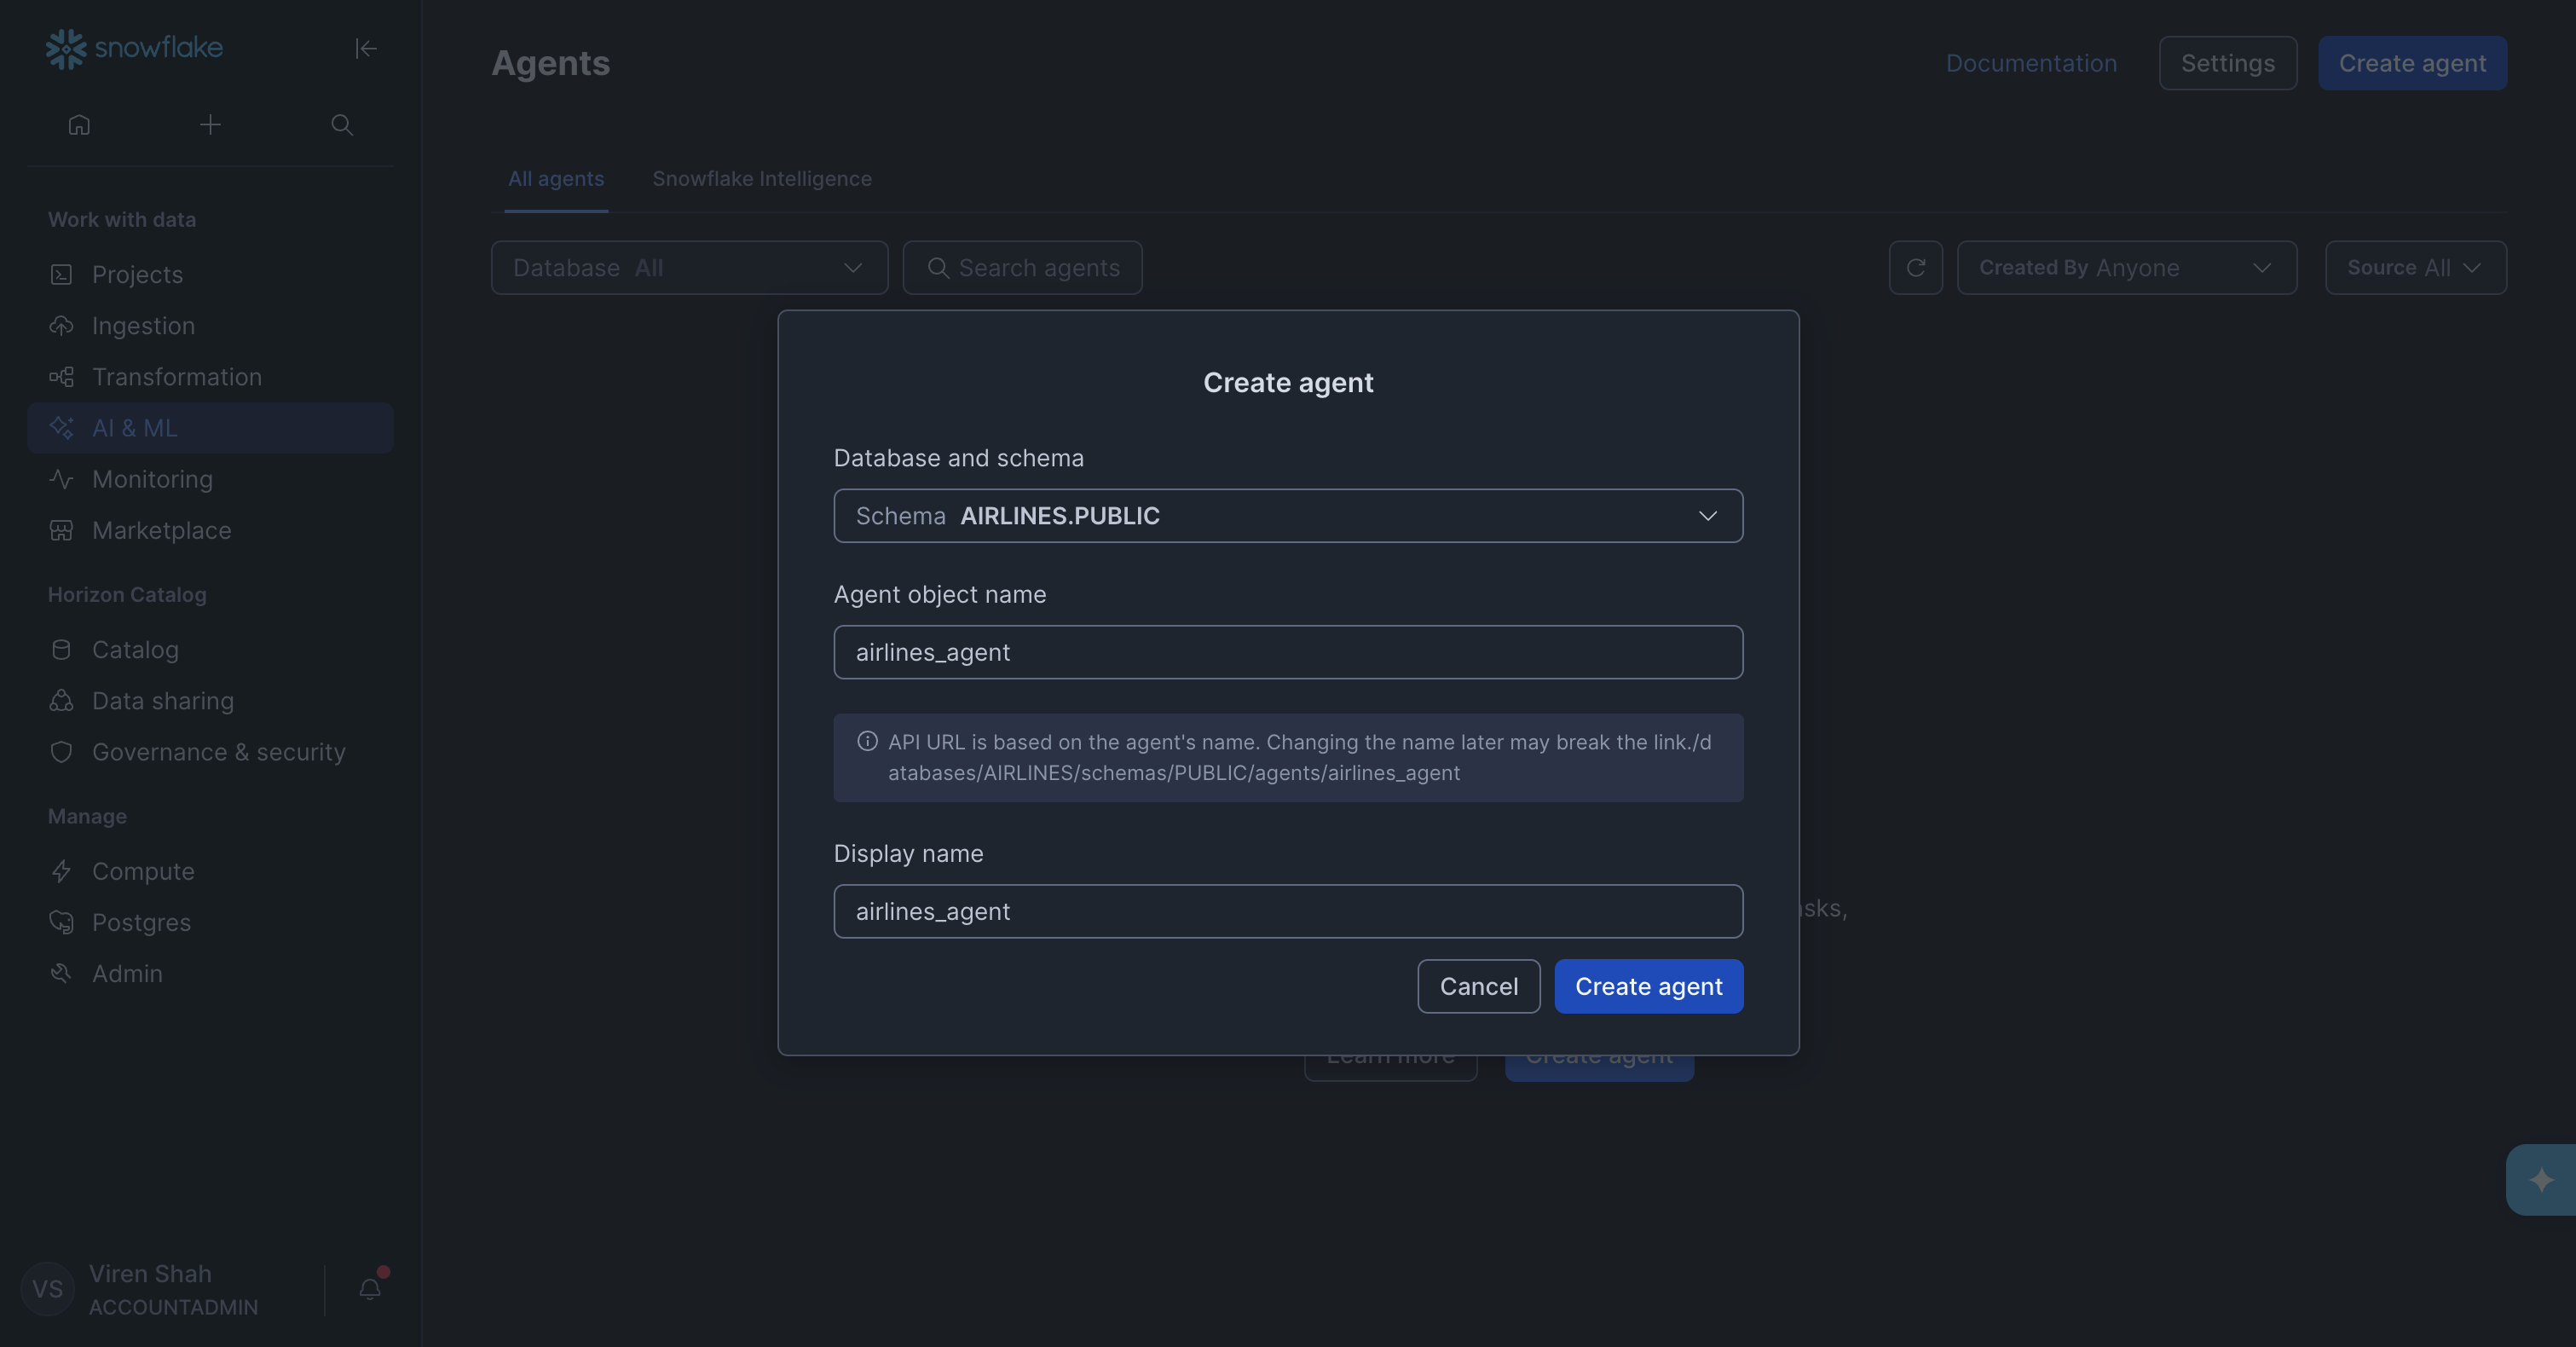
Inside the agent setup, we then added a Cortex Analyst tool and pointed it at the semantic view we had just created.
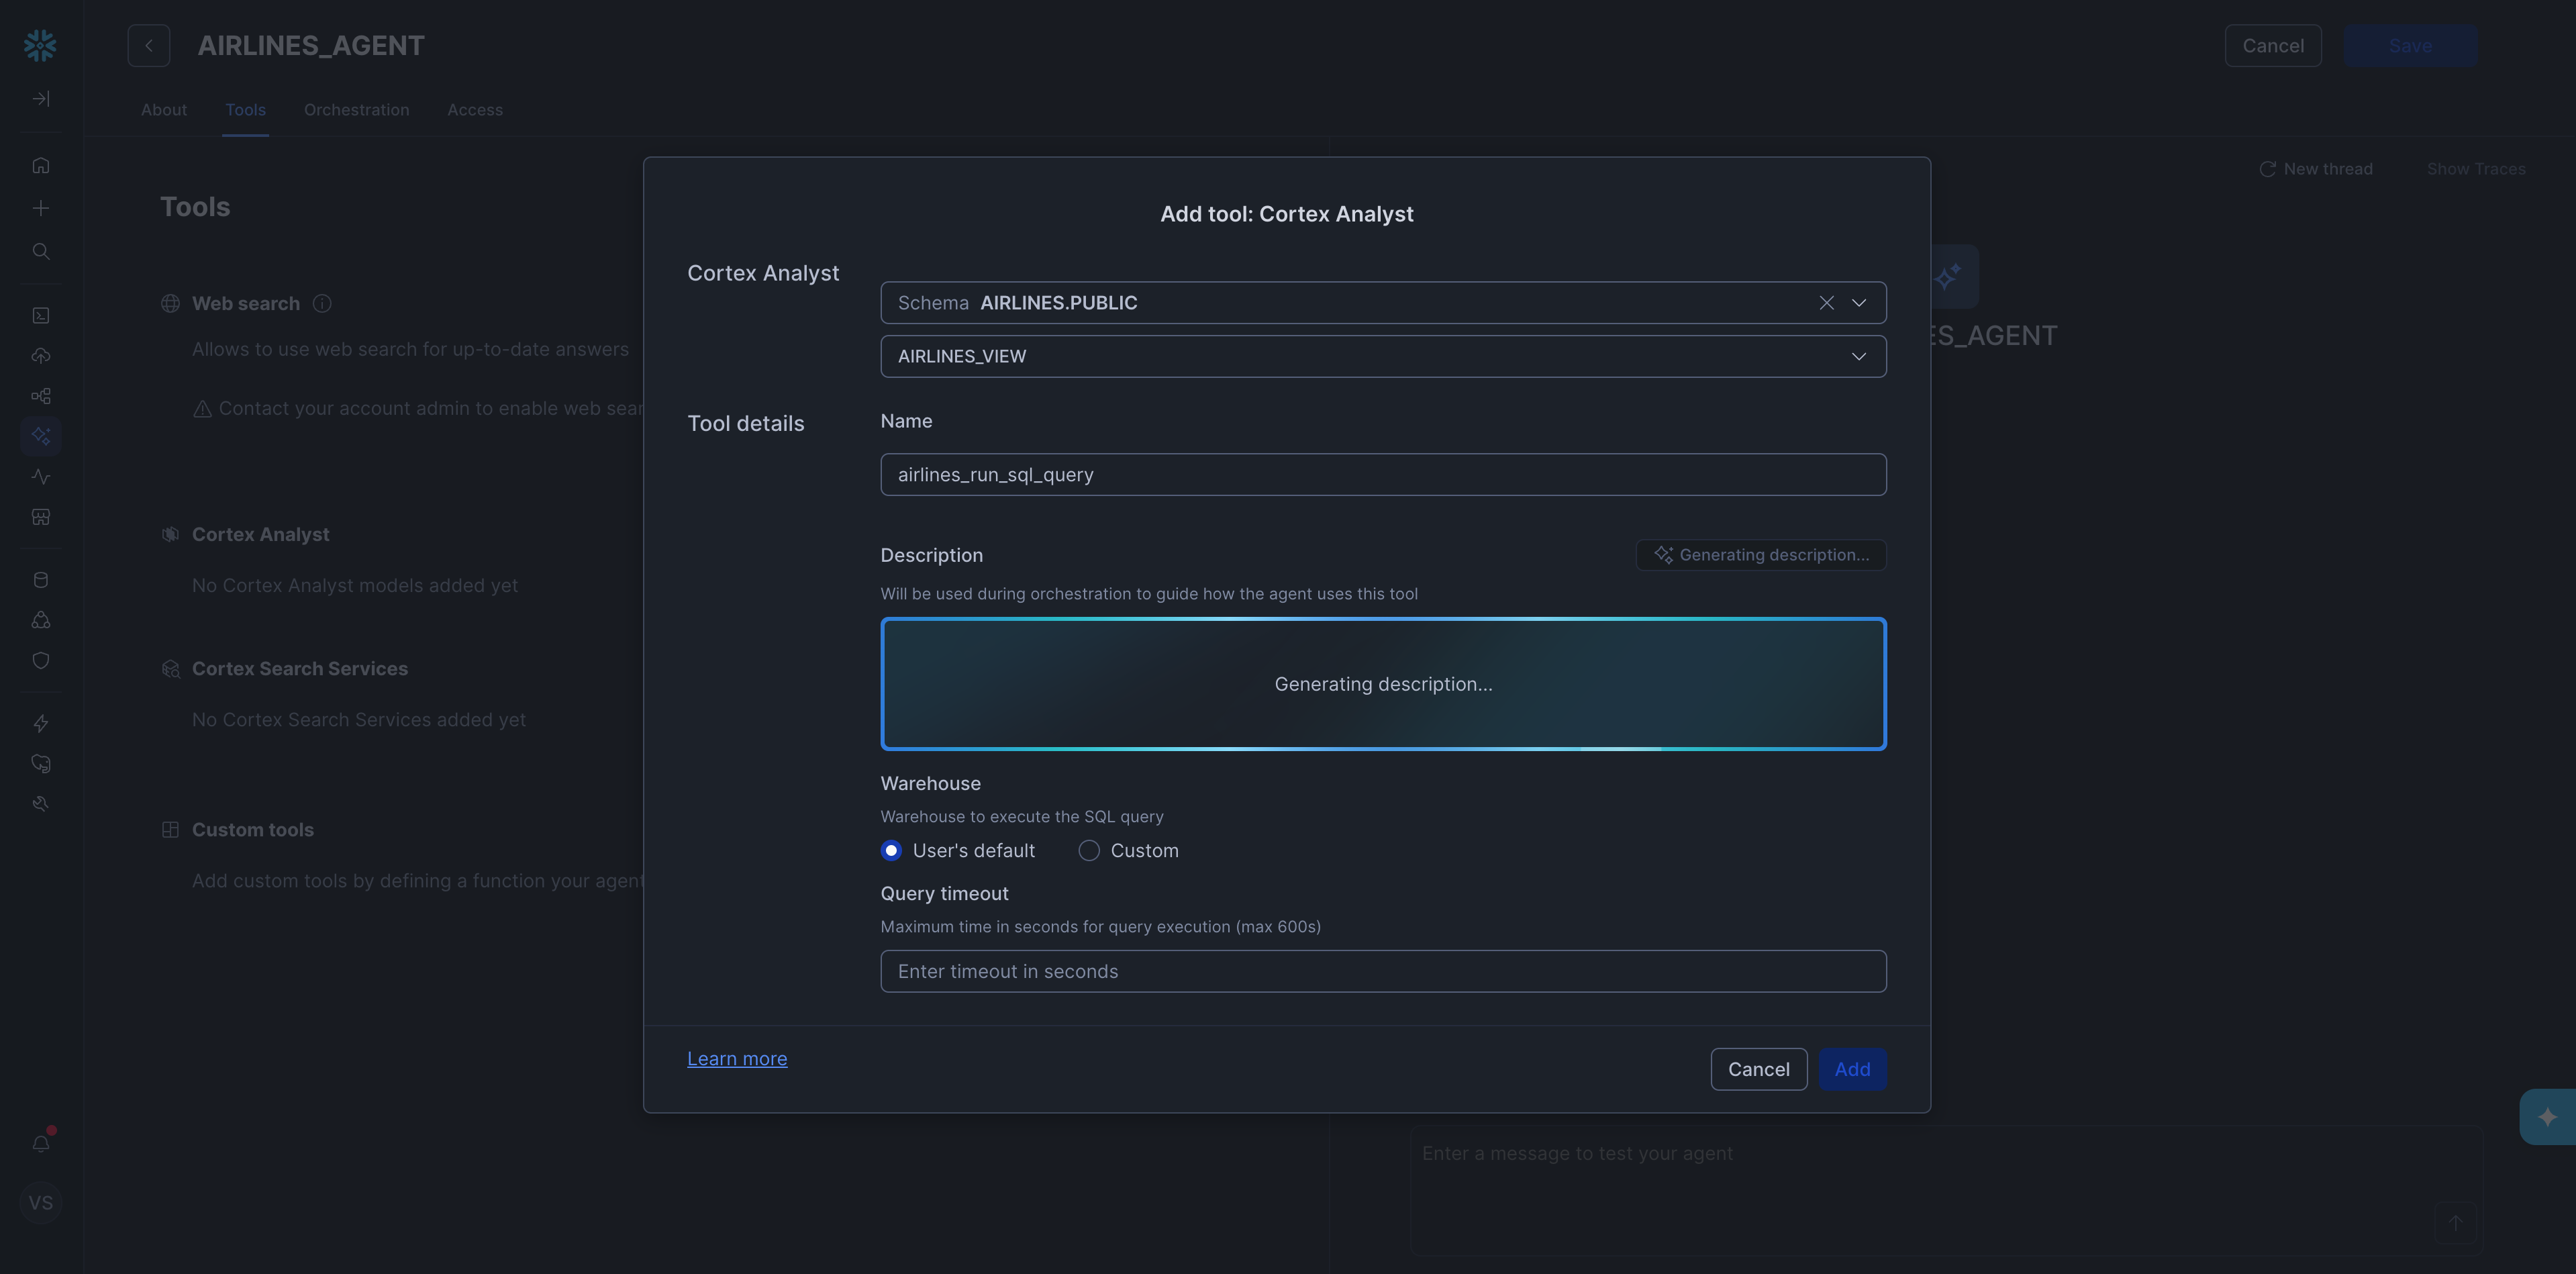
With the agent set up, we asked each diagnostic question one by one. The full list of diagnostic questions is in the Appendix. All five came back correct right away, which was a good sign.
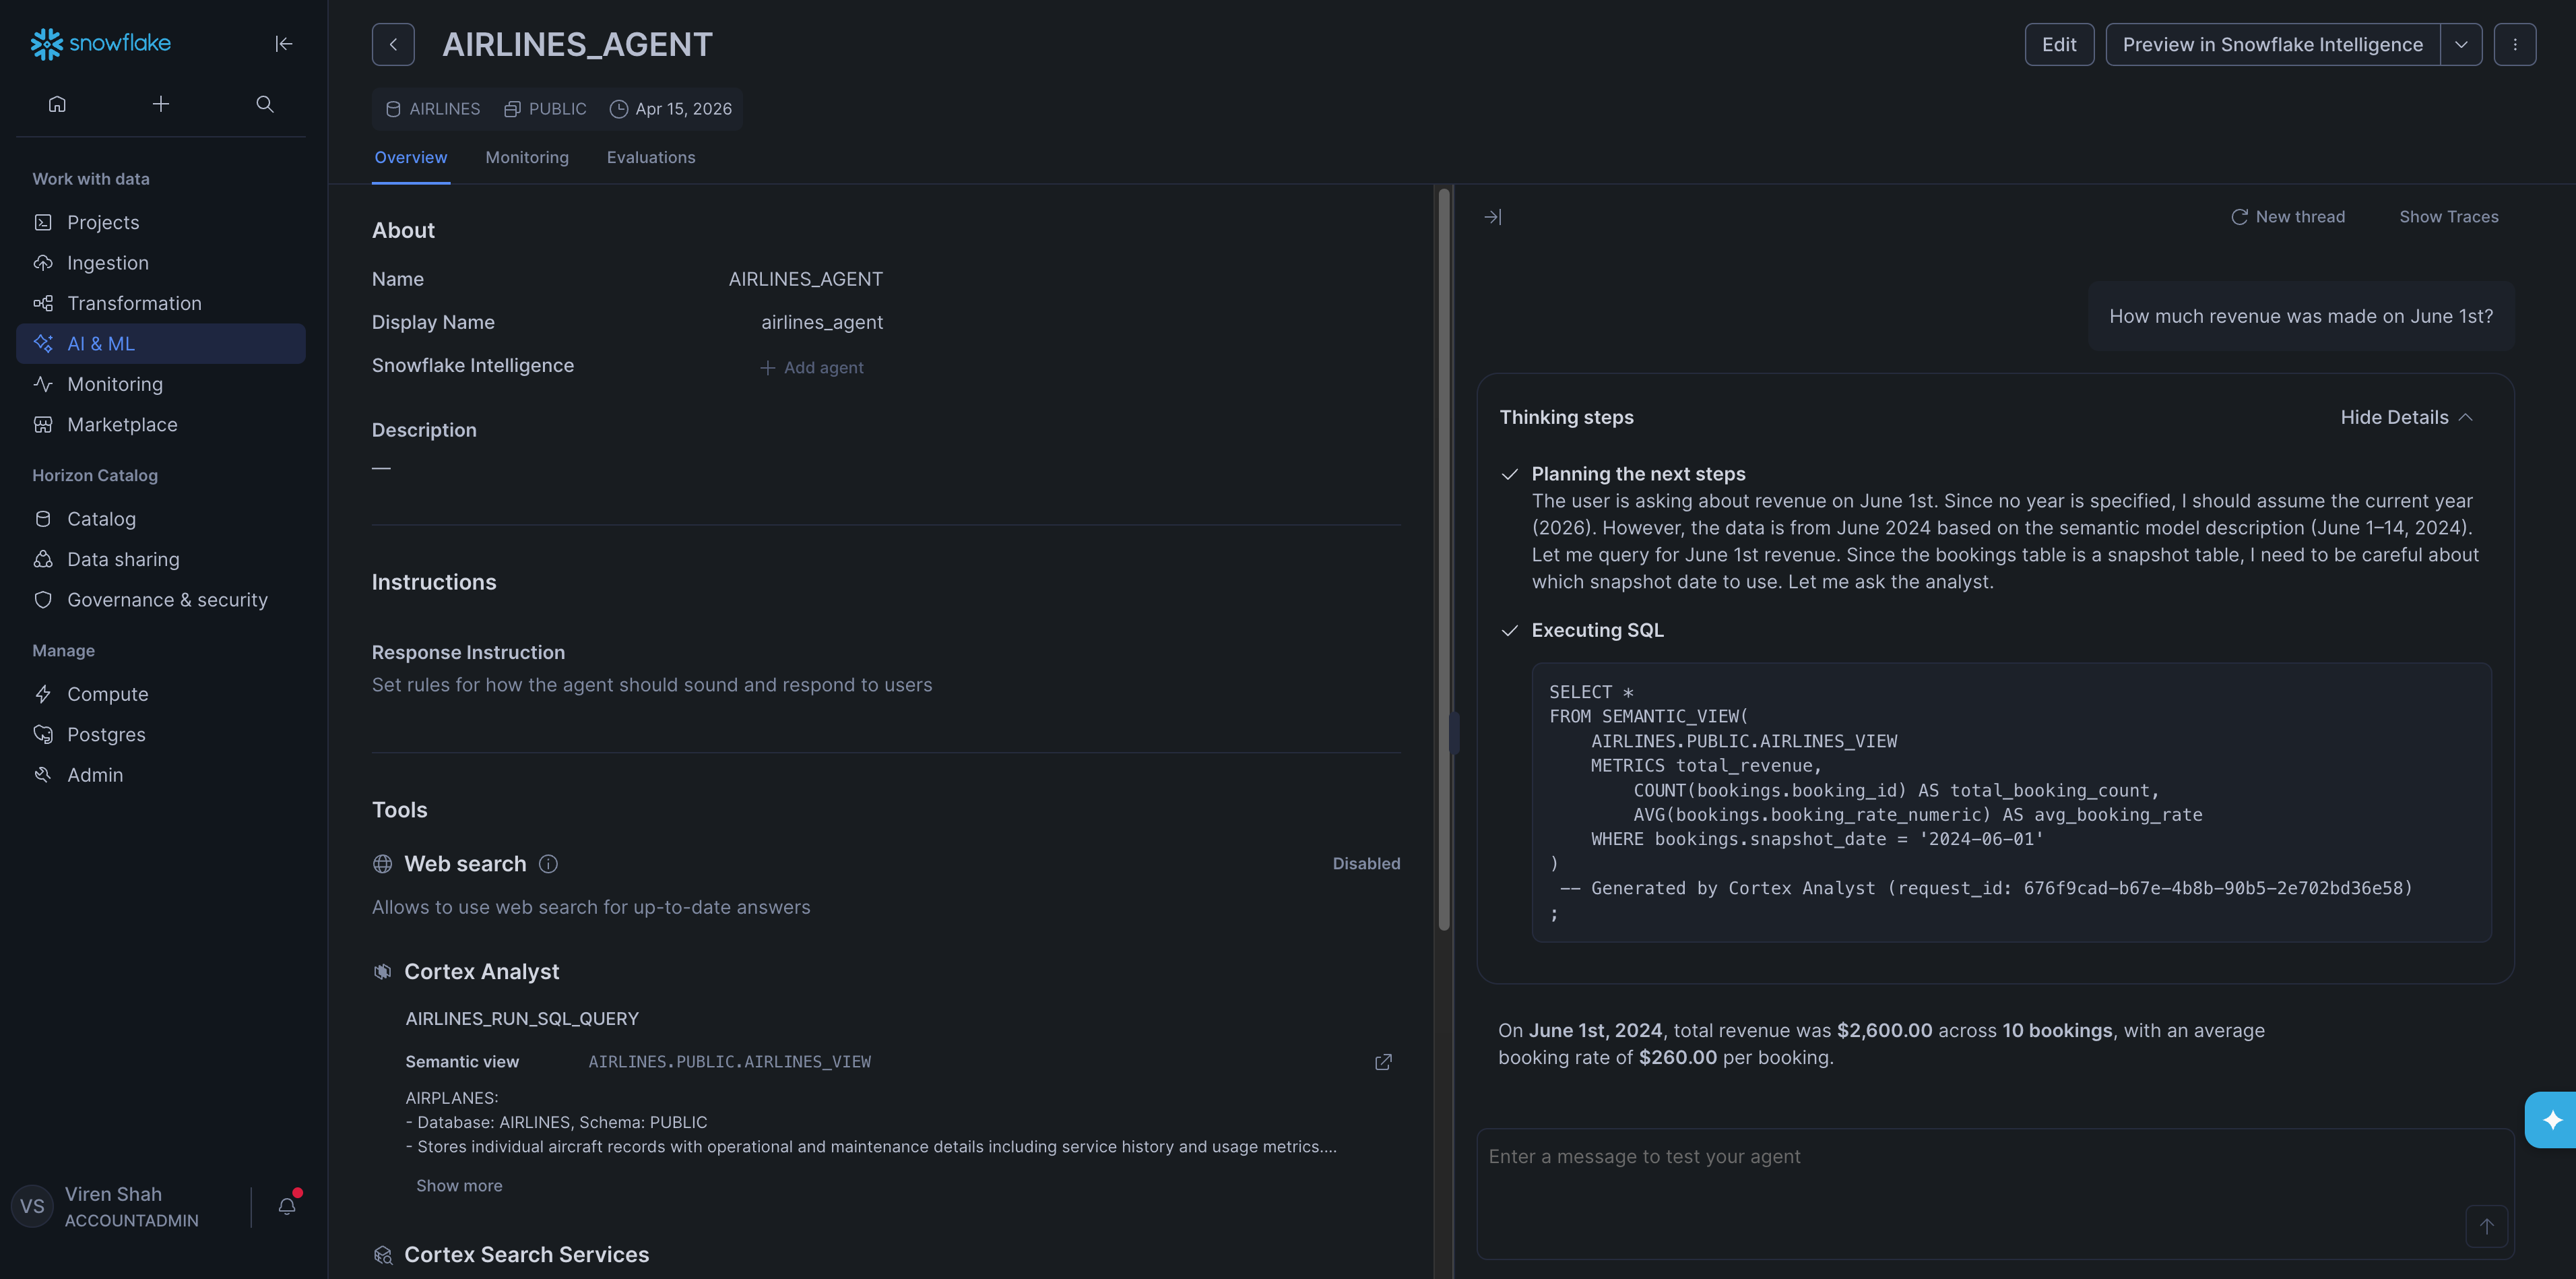
Training took 10 min 40 sec of active user time and 23 min 50 sec of wall clock time. The gap reflects idle waiting across several steps including: the Cortex AI Assistant generating the Semantic View, the Analyst generating descriptions, the agent processing each diagnostic question, etc.
Iris
To train Iris, we uploaded the dataset README and sent it with the same prompt we used with Snowflake: "Please update your metrics / dimensions using the information in this readme. Please ensure you extract all the information."

Iris processed the README and proposed 22 additions to its business context — new metrics, dimensions, and join definitions inferred directly from the schema description. We reviewed and accepted them in one click.
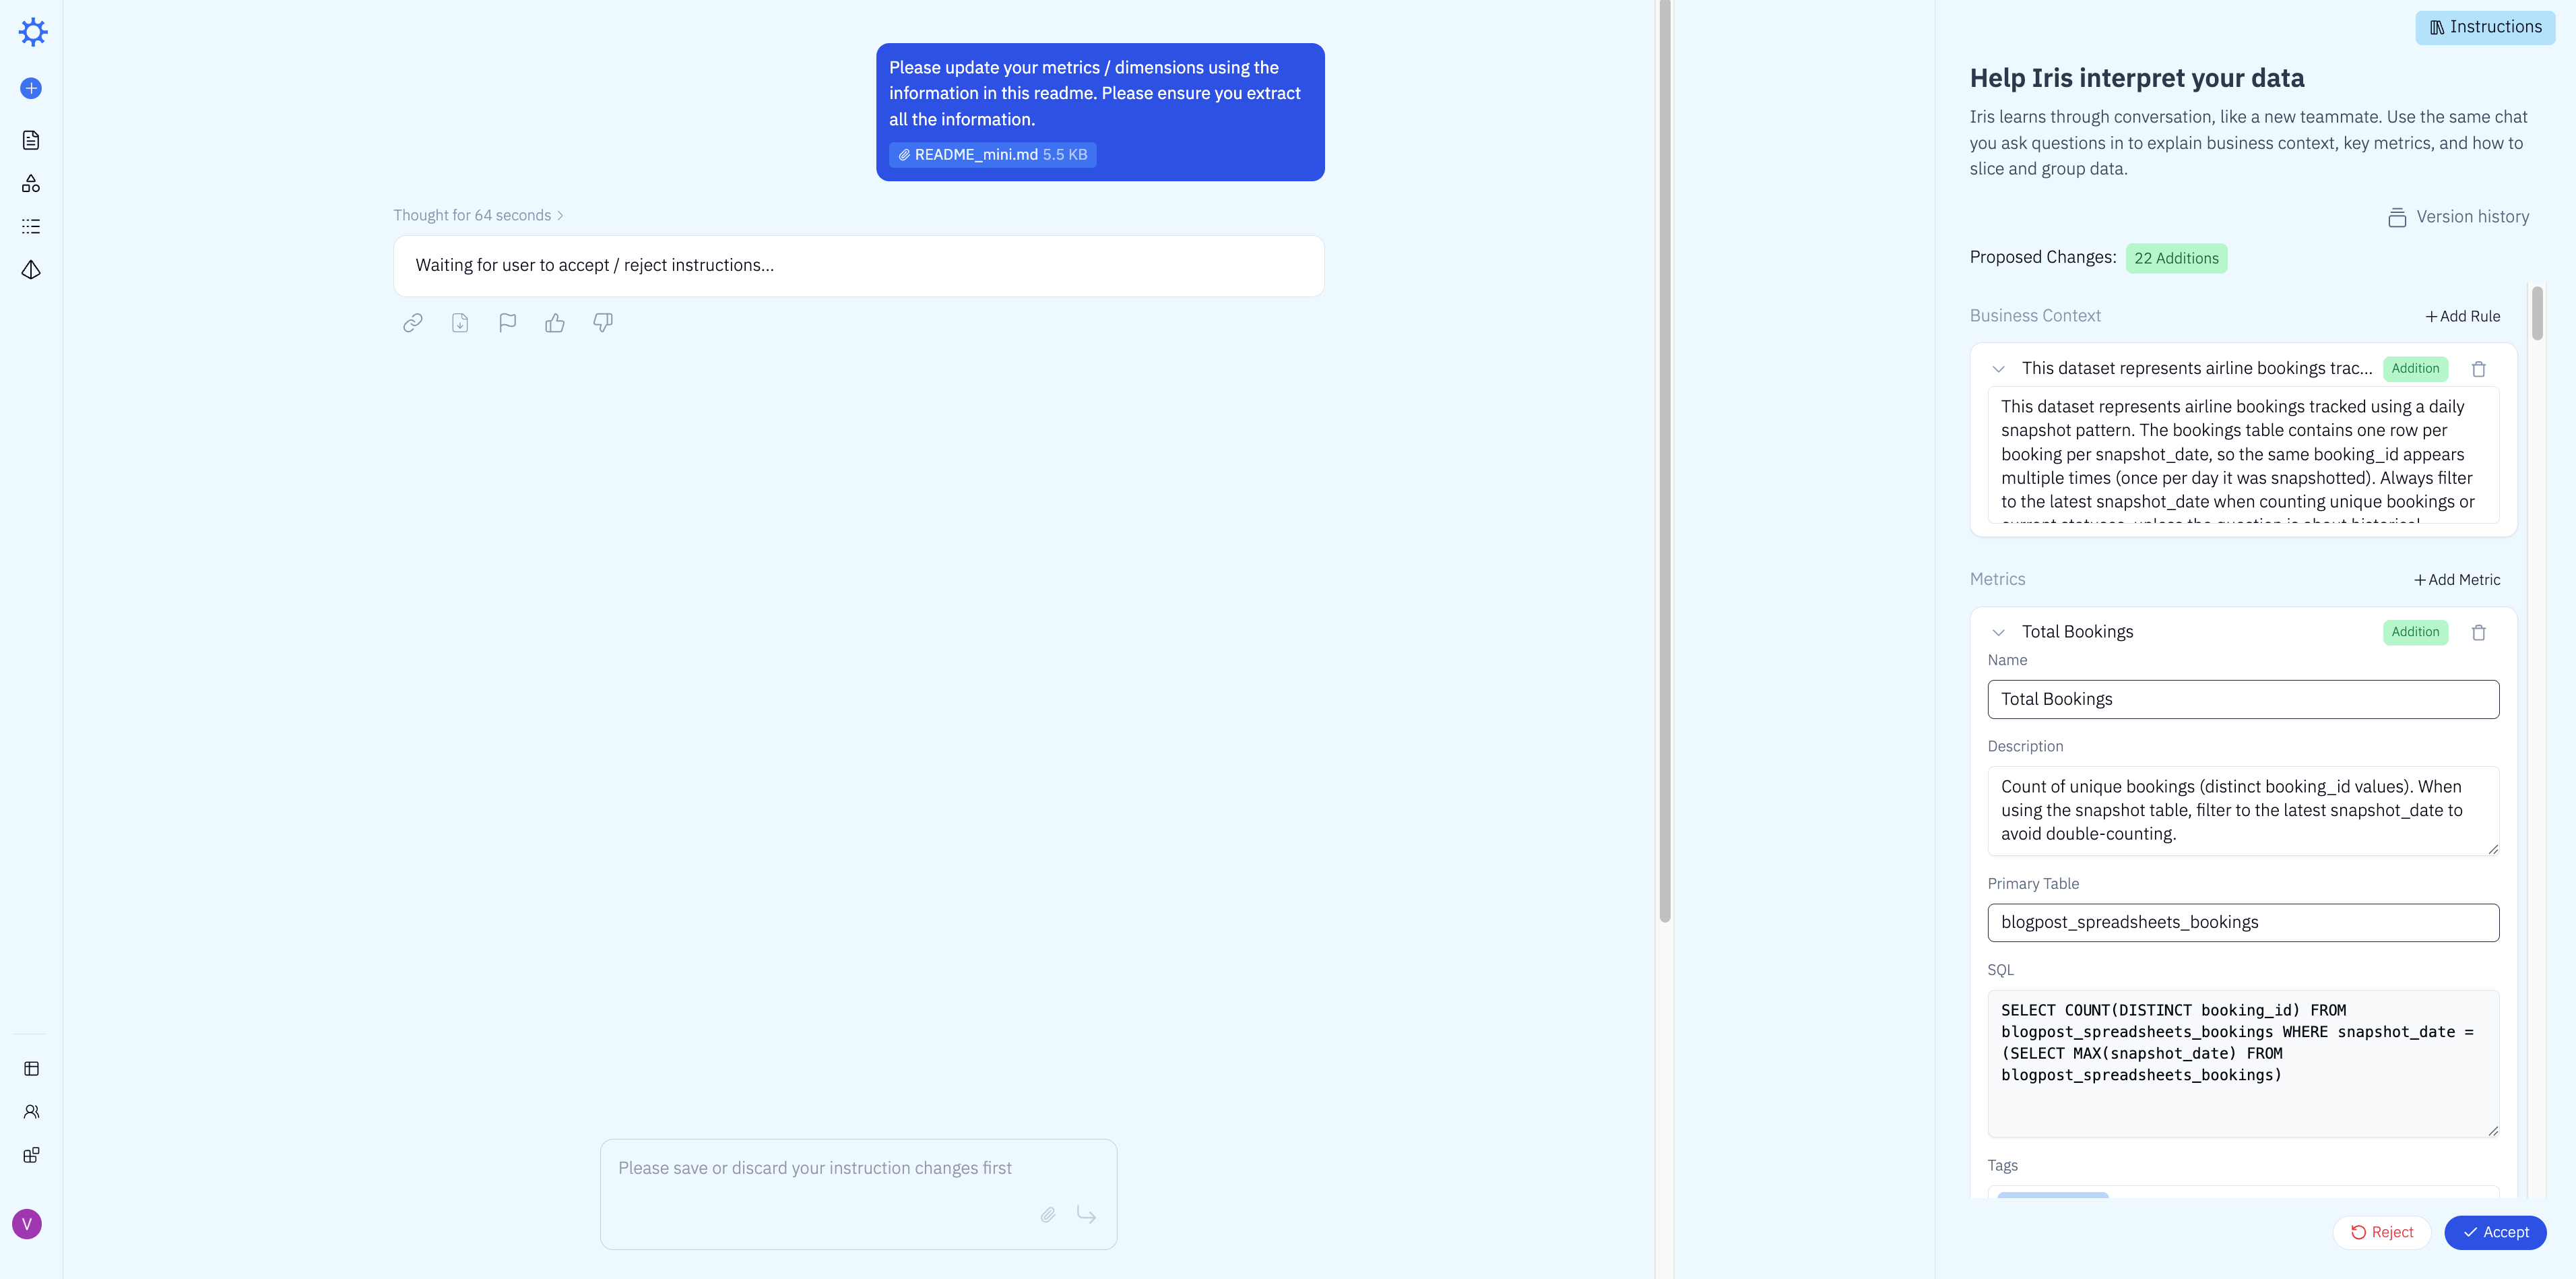
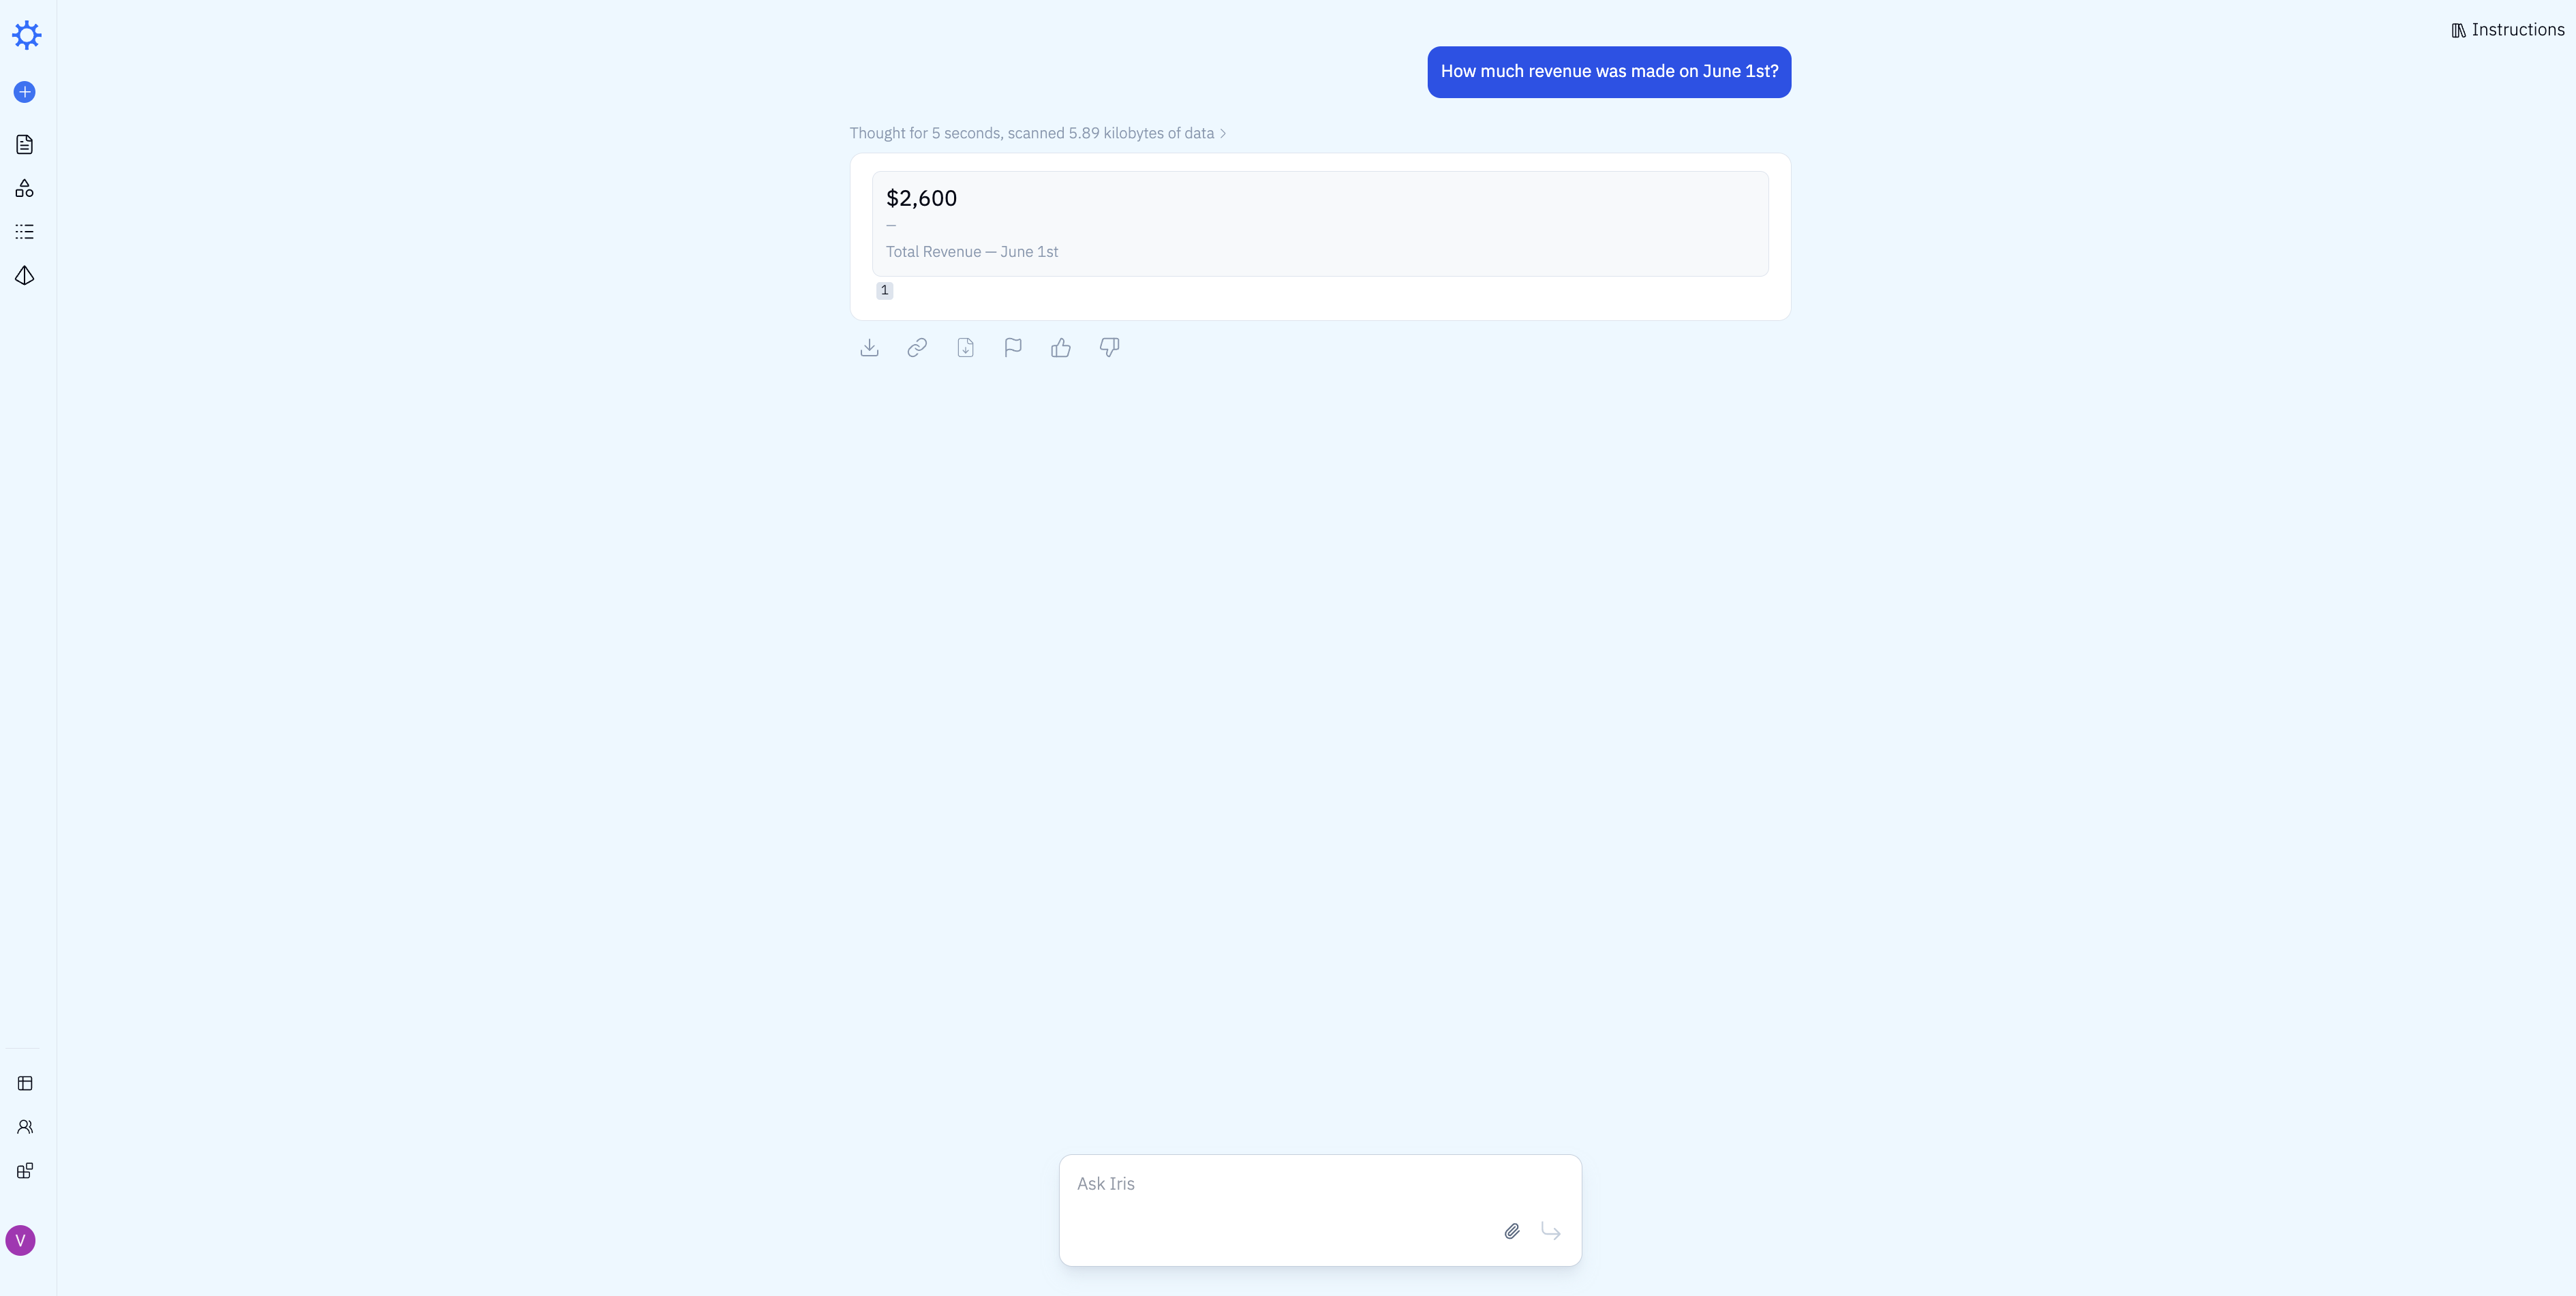
We then asked all 5 diagnostic questions sequentially. All 5 came back correct on the first attempt — no iteration needed. Here's an example: Iris answered "How much revenue was made on June 1st?" correctly in 5 seconds, scanning 5.89 KB of data.
Total time: 2 min 30 sec of active user time and 4 min 45 sec of wall clock time.
Total Setup Time
Combining data loading and training, here's how much time each tool required to reach 100% accuracy on the diagnostic questions.
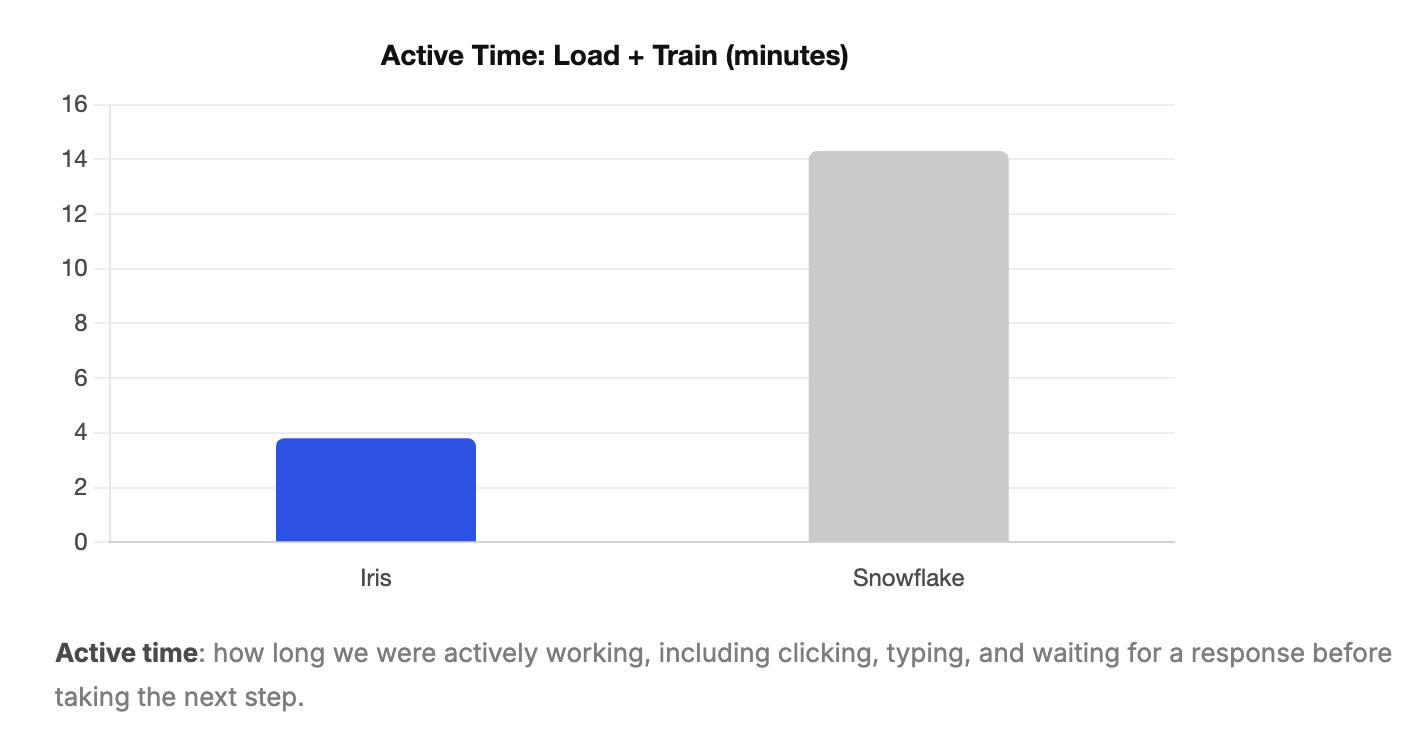
Because our test dataset was small, both tools trained relatively quickly in absolute terms. But the roughly 3x speedup in Iris's active training time matters more than it might appear. On a real production schema with dozens of tables, more complex relationships, and a larger README, that multiplier compounds. The gap between tools would likely be significantly wider in a real deployment.
Evaluation
With training complete, we asked each tool a set of real-world business questions that were not part of the training set and that require a deeper understanding of the data to answer correctly. Some involve subtle distinctions in how the question is phrased. Others require multi-table joins or knowledge of the snapshot pattern. None were questions the tools had seen before.
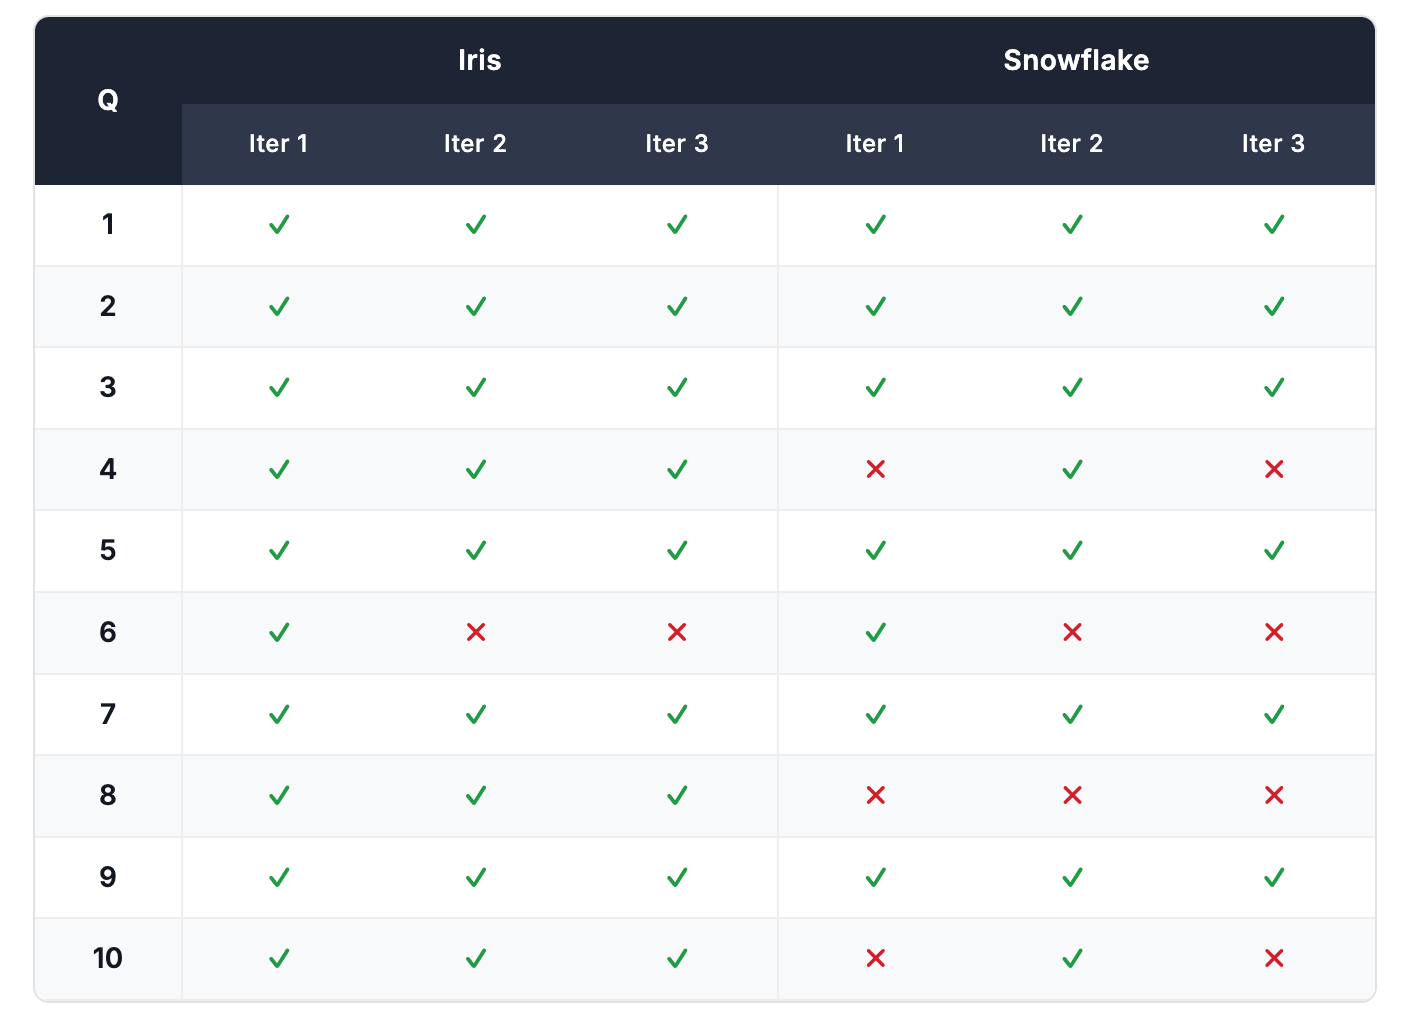
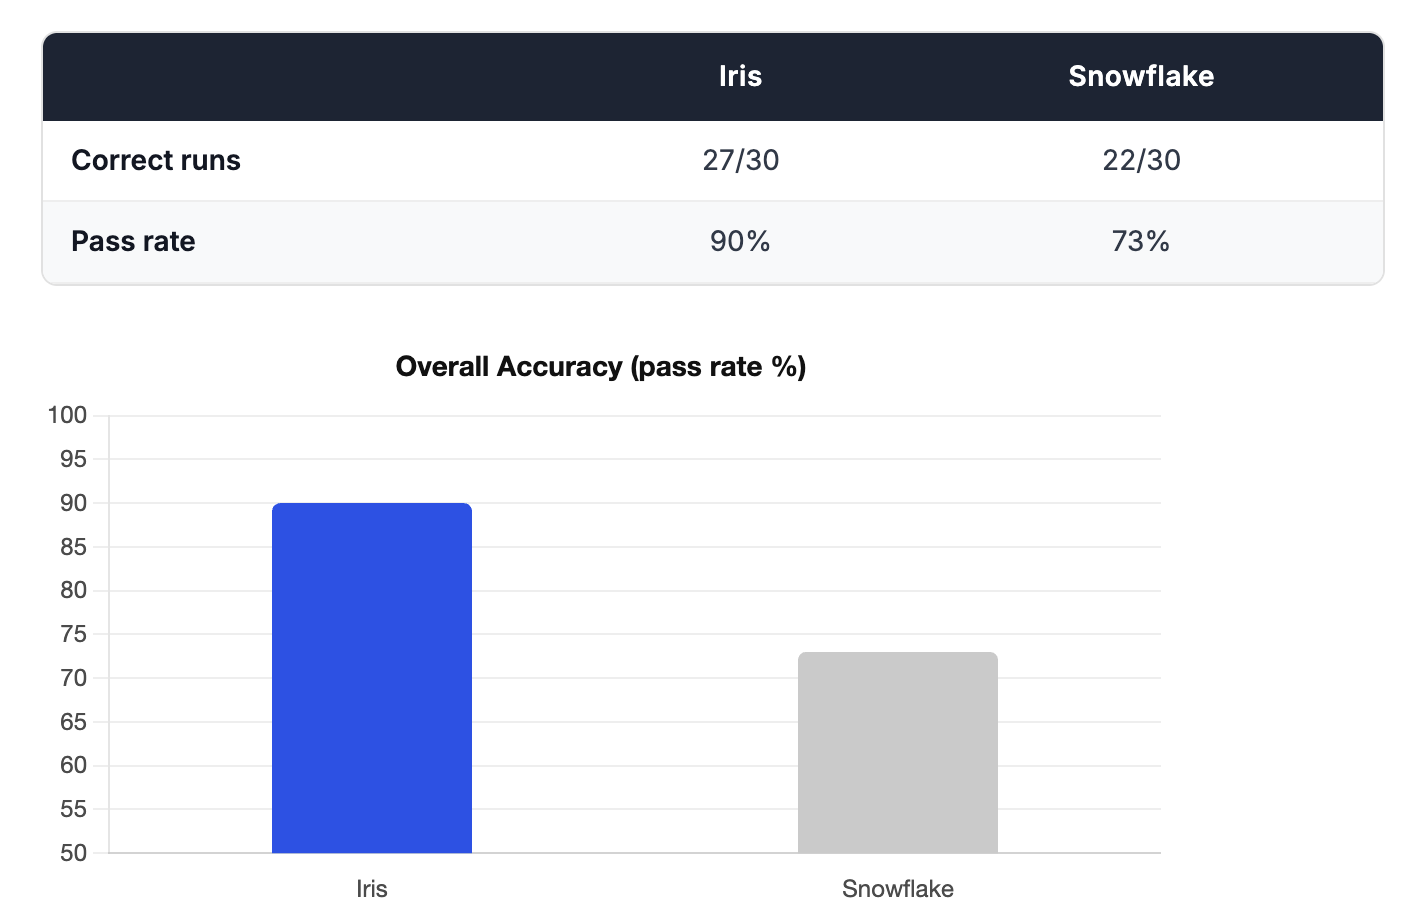
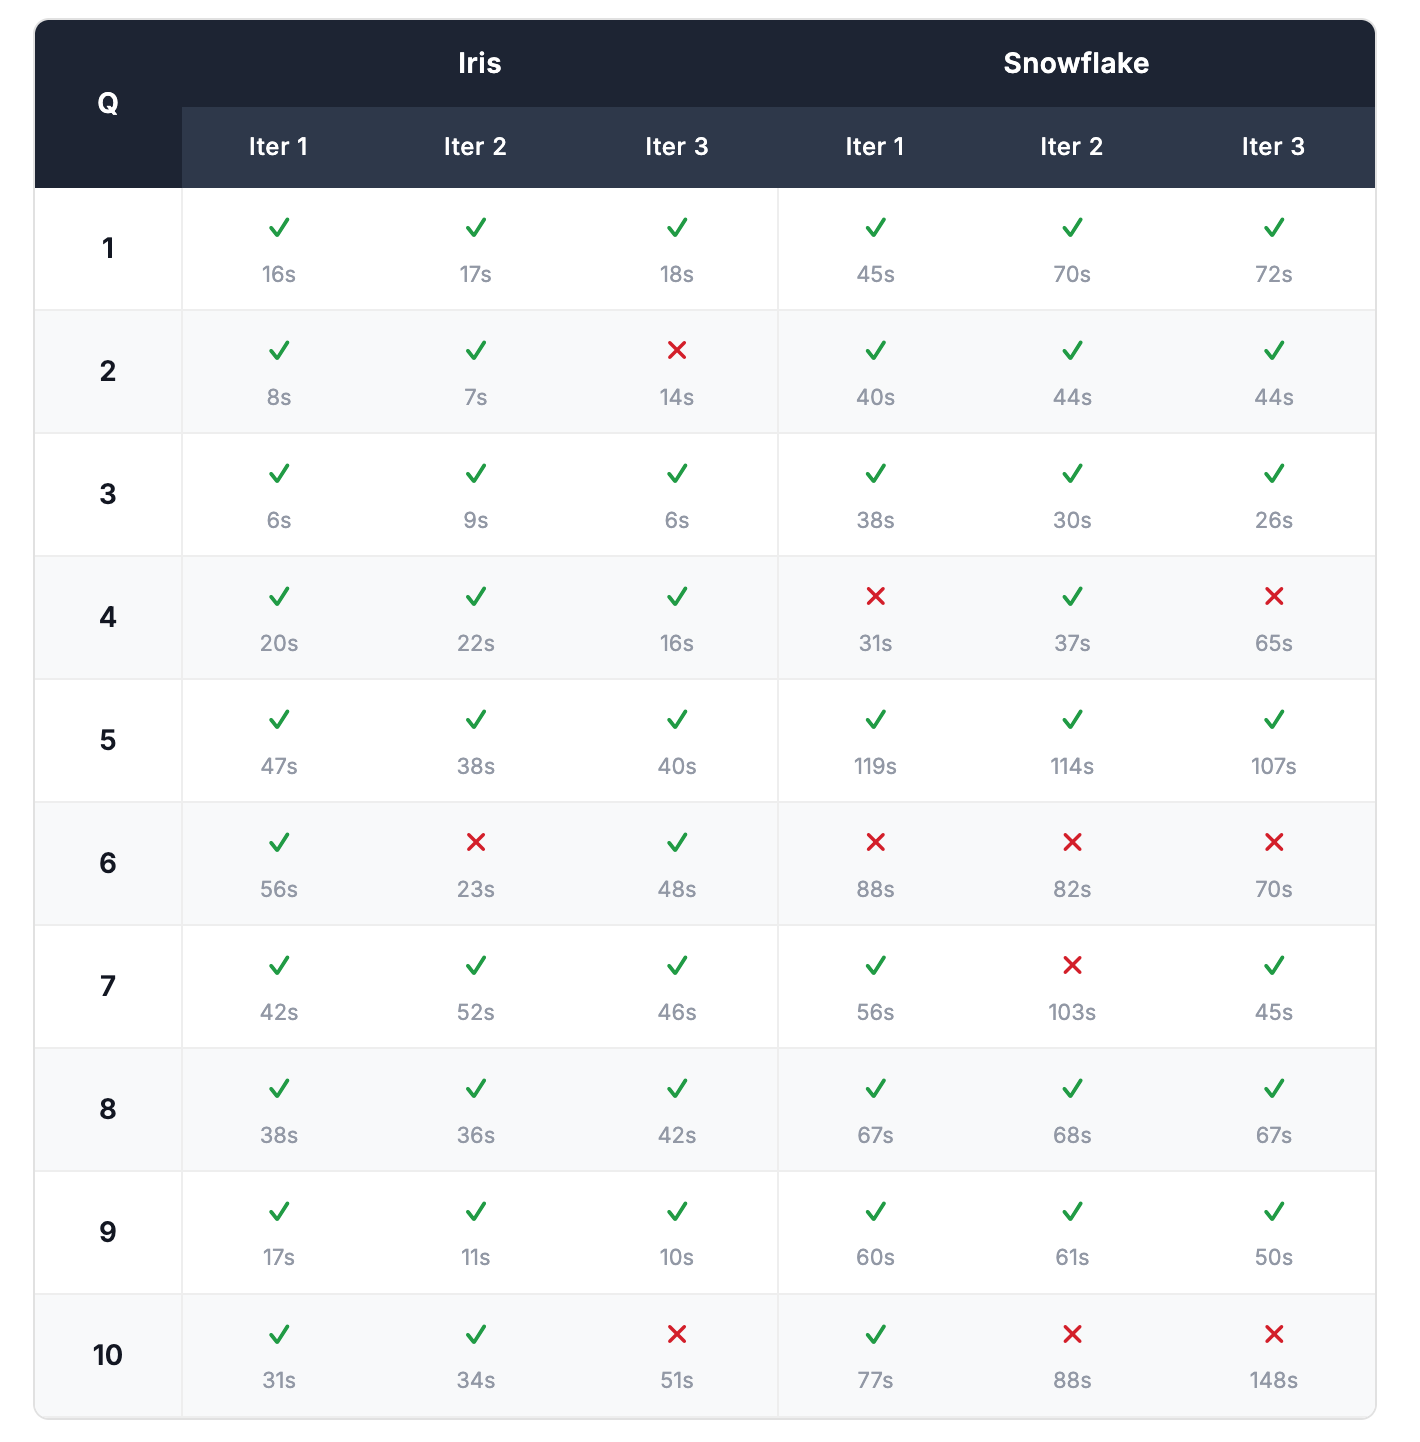
We tested 10 real-world questions and asked each one 3 times. AI systems don't always give the same answer twice. The same question can produce a correct answer one moment and a wrong one the next. Asking each question 3 times gives a more honest picture of how reliably each tool performs, rather than getting lucky (or unlucky) on a single attempt. We scored each answer as correct or incorrect based on the expected values defined in the Appendix. Full per-run results are in the Appendix.
Accuracy
Latency
Reproducibility
After completing the first benchmark, we ran the entire process a second time from scratch: fresh data loading, new training, and a full second set of evaluation runs. This was to check whether the results were stable or whether a different setup could produce meaningfully different outcomes.
The overall scores held. Snowflake scored exactly 22/30 in both runs. Iris scored 27/30 in Run 1 and 28/30 in Run 2 — a consistent 90%+ pass rate in both cases.
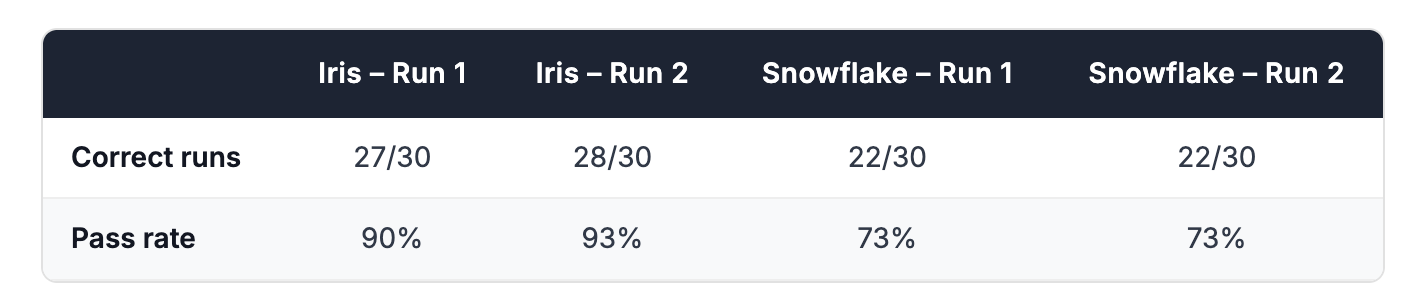
That said, the specific questions each tool got wrong shifted between runs. Snowflake answered Q8 (average satisfaction per aircraft model) correctly on every attempt in Run 1 but failed it entirely in Run 2. Q7 (seat complaints) showed the opposite pattern. This is expected: LLM-powered tools are non-deterministic, and the same question can succeed in one run and fail in another. It's part of why we ran each question three times and why repeating the full benchmark matters. The consistency of the aggregate scores across two independent setups gives us confidence that the headline results are meaningful — not artifacts of a single lucky or unlucky run.
Full per-run links for Run 2 are in the Appendix.
Conclusion
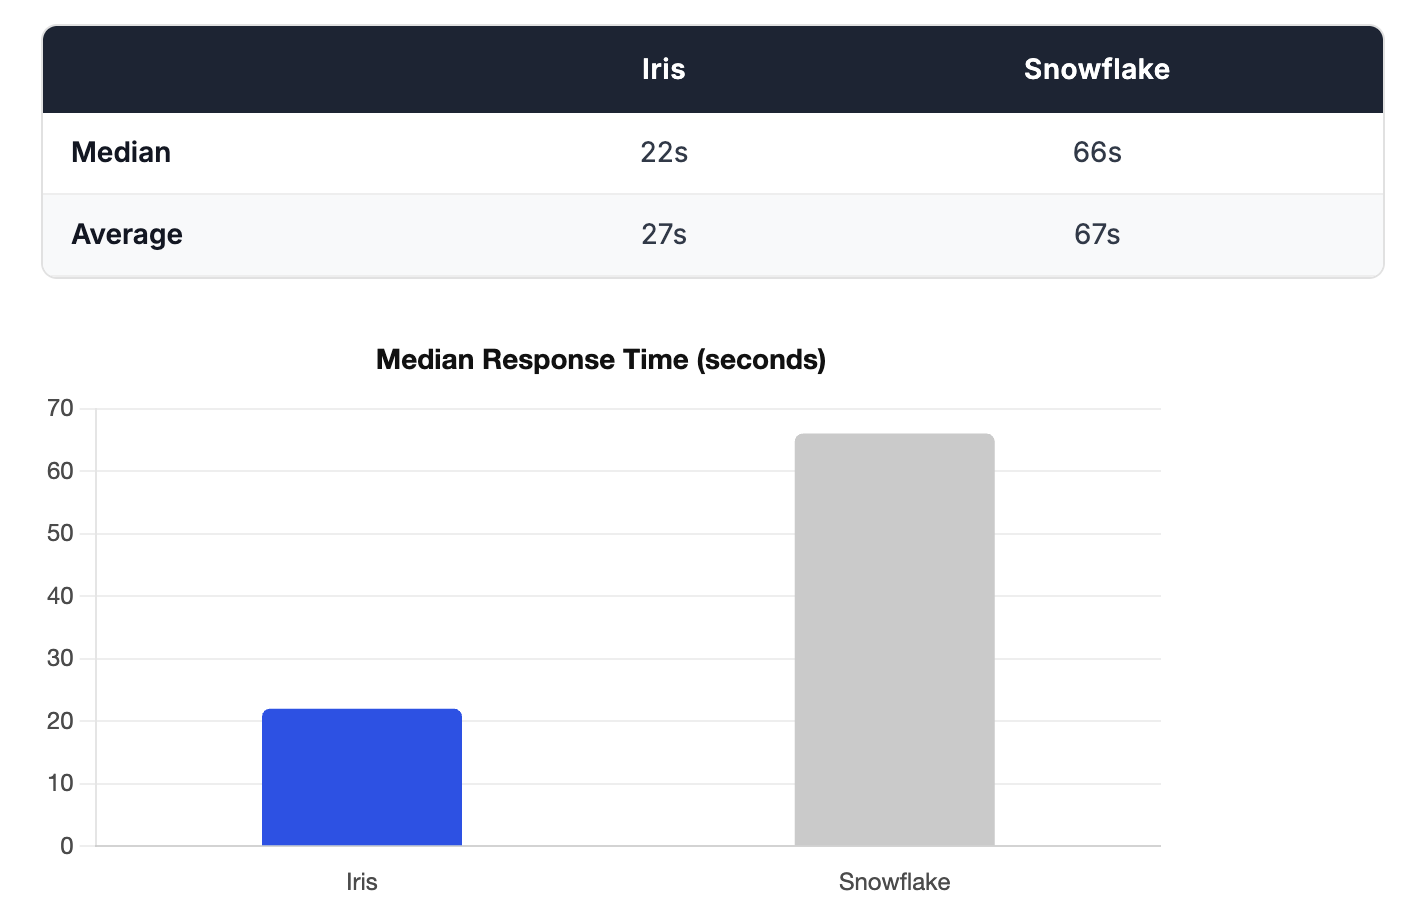
The numbers tell a clear story. Iris got up and running in a fraction of the time, answered questions faster, and got more of them right.
That combination matters. Most AI analytics tools force a tradeoff: you either invest heavily in setup and tuning to get good answers, or you cut corners and accept lower accuracy. Iris breaks that tradeoff. Less time to set up. Lower latency on every query. Higher accuracy on the questions your business actually asks.
With Iris, you get to a higher level of value faster, and you stay there.
Appendix
Full details on the dataset and evaluation questions used in this benchmark can be found on GitHub.
Dataset
The dataset models a small airline's operations over a 14-day window (June 1–14, 2024). It spans 7 tables totalling roughly 2,150 rows and is designed to reflect the kinds of patterns that appear constantly in real production schemas: snapshot tables, multi-table joins, JSON columns, and subtly ambiguous business logic.
Snapshot tables
bookings and seats are daily snapshot tables: the same record appears once per snapshot_date, allowing consumers to track how state changes over time. This means every booking appears up to 14 times in the table. Any query asking about "current" state must filter or deduplicate on snapshot_date to avoid inflated counts and totals, a common source of silent errors.
Booking status follows a terminal-state model: once a booking reaches Completed (4), Cancelled by Customer (3), or Cancelled by Airline (5), its status never changes. Price (booking_rate) is also fixed at first-appearance and stored as a $-prefixed string, requiring a cast before any arithmetic. The seats table omits rows for status-4 and status-5 bookings, which means the row count cannot be used as the denominator for occupancy calculations. Seat capacity must come from airplane_models.capacity.
JSON columns
Survey questions and responses are stored as JSON arrays in survey_templates.template_questions and surveys.template_responses respectively. Answering questions about passenger feedback requires parsing these columns rather than filtering on flat fields.
Multi-table joins
Most meaningful questions span at least three tables. The foreign key relationships are:
bookings.flight_id→flightsflights.tail_number→airplanesflights.model_id→airplane_modelsseats.flight_id→flights. Linking a seat to a specific booking requires a composite join onflight_id + seat_number + snapshot_datesurveys.booking_id→bookingssurveys.template_id→survey_templates. To correlate a response to its question text, both JSON arrays must be parsed and matched onqid, which is scoped per template and not globally unique
Evaluation Results
Run 1 Results
Per-run correctness and response times across all 10 questions and 3 runs.
Run 2 Results
This was just done to validate the reproducibility of the results. Response times were not recorded this time.