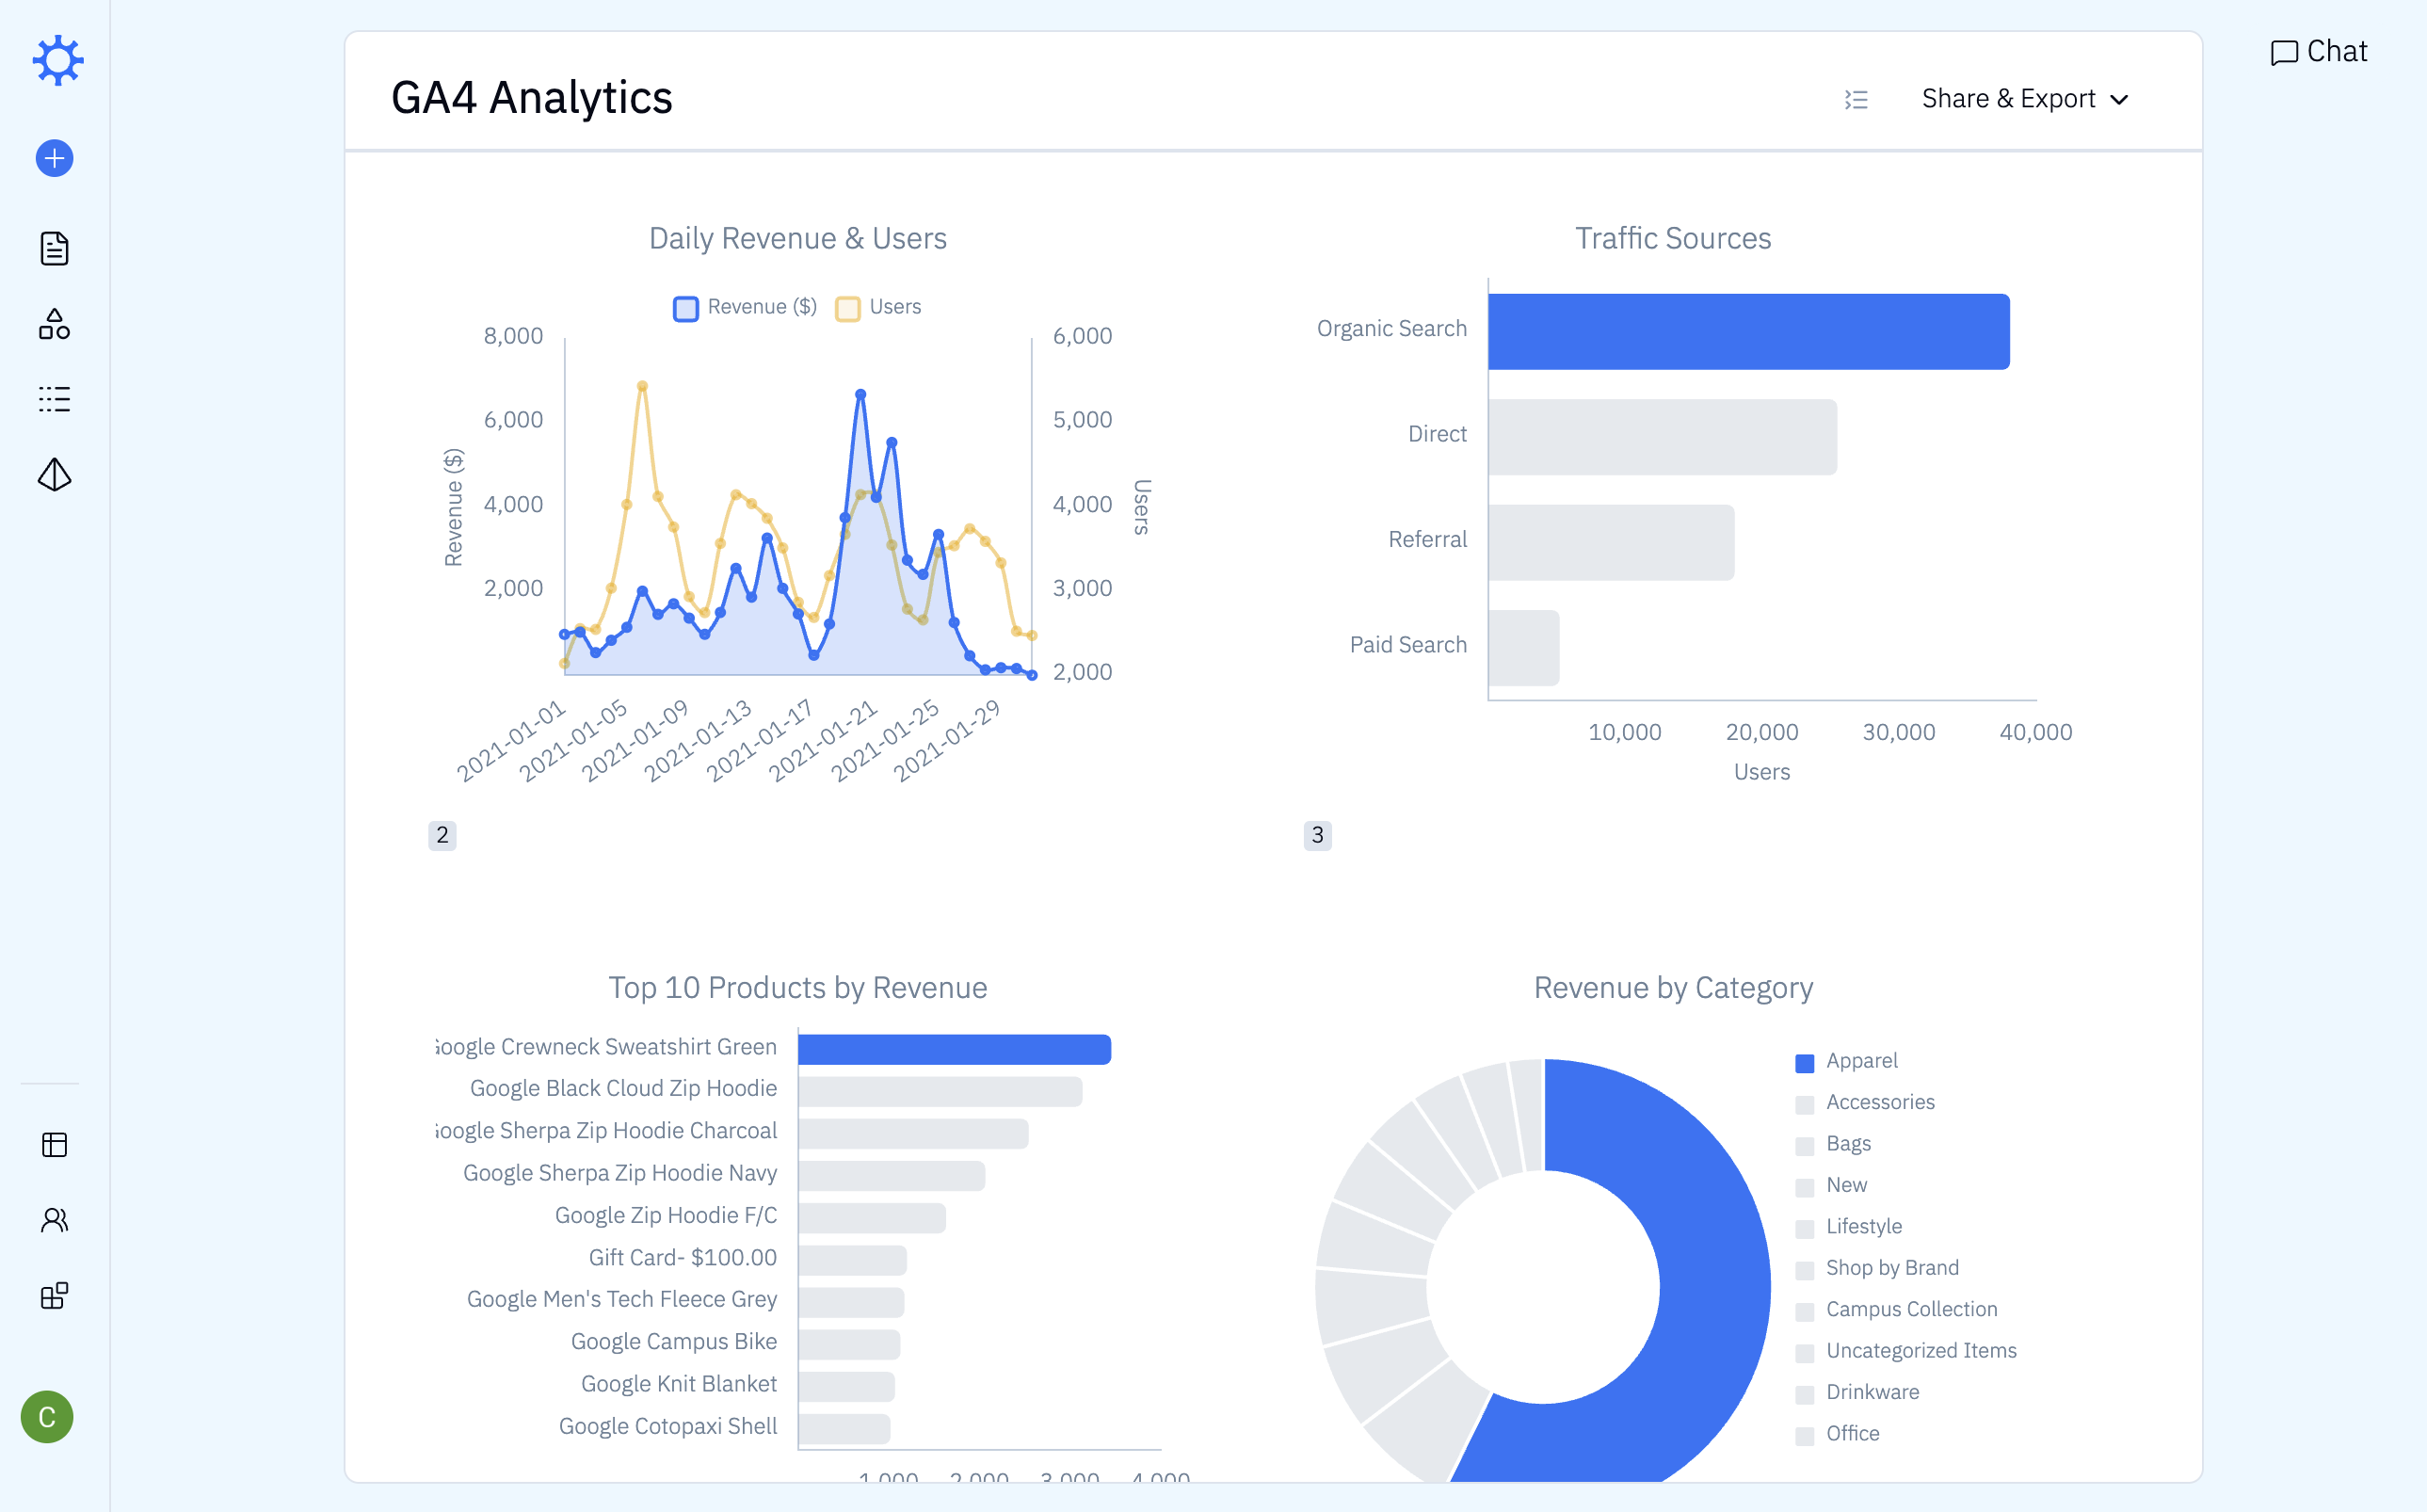
Claude’s new live artifact feature allows you to build dashboards connected to real data, similar to Iris Apps. While trying it out, I noticed Claude has a rendering bug where charts can grow infinitely in height.
We’ve encountered this issue at Iris as well. Claude and Iris both make use of the Chart.js library. The issue is that Chart.js charts will resize to fill their container when configured with responsive: true and maintainAspectRatio: false — but if the container's height is determined by its content (the canvas), you get a feedback loop where the chart keeps growing.
We initially attempted to fix this by prompting the LLM to avoid this configuration, but we struggled to get the LLM to follow the instruction consistently.
We ultimately solved this by bringing control of the Chart.js rendering into our React frontend. The LLM still has control over the visual flow in both Iris conversations and Iris apps, but every chart renders inside a div that we can style explicitly with width and height parameters. This also allowed us to have more control over many other aspects of chart rendering. We even have custom color schemes consistent with each of our customers' brands!
This is an interesting puzzle when developing generative UI with LLMs — as the user experience evolves and becomes increasingly sophisticated, we are always asking: how much can be left up to the LLM, and what scaffolding is needed to support the rendering of the LLM’s generated UI?