
Every Monday morning, the Walmart merchant sitting across from you has already run the numbers. They know which of your items stocked out over the weekend. They know your OTIF rate for the last five weeks. They know which SKUs are sitting at triple-digit weeks of supply. The question is: do you know first?
Meet Iris
Iris is an AI-powered analytics platform built for consumer goods suppliers and other business workflows where data fluency is a competitive advantage. It connects to the data files you already work with — Scintilla exports, Retail Link files, OTIF scorecards, plan files, markdown logs — and answers business questions in plain English.
No SQL. No analyst queue. No dashboard to configure. The analysis that used to take a team two weeks now takes seconds.
You upload the data from Walmart or any retailer - no restrictions on the number of files or size of data, ask a question in plain English. Iris auto models the data, returns insights — with charts, item-level detail, and a ranked list of what to do next. Seconds, not weeks.
The view from Bentonville
Walmart's reporting infrastructure for suppliers — Retail Link, Scintilla, the OTIF scorecard — is data rich. The retailer can surface sell-through anomalies, inventory gaps, and fulfillment failures faster than most suppliers can pull a weekend recap from their own systems. That asymmetry used to be accepted as the cost of doing business: the merchant held the analytical high ground, you held the relationship.
The suppliers protecting shelf space today are the ones who close that gap before the meeting, not during it. They walk in having already identified the problem, diagnosed the cause, and drafted the fix.
What this looks like in practice: Toyland Inc.
We ran a live analysis of Toyland Inc. — a fictional mid-market toy and games supplier to Walmart — starting from the weekly POS files available in Scintilla, Walmart's supplier data portal. Two uploads. No data pipeline. No warehouse.
Step 1 — Upload weekly sales files
Five weekly POS files for weeks 44–48, exactly as exported from Scintilla. Iris combined them automatically, validated the data, and confirmed 73,377 unique store-item-week rows with zero duplicates.

Step 2 — Augment with reference files
Six supporting files uploaded simultaneously — store/DC alignment, pipeline inventory, category benchmarks, markdown history, OTIF scorecard, item plan. Iris mapped every join automatically.
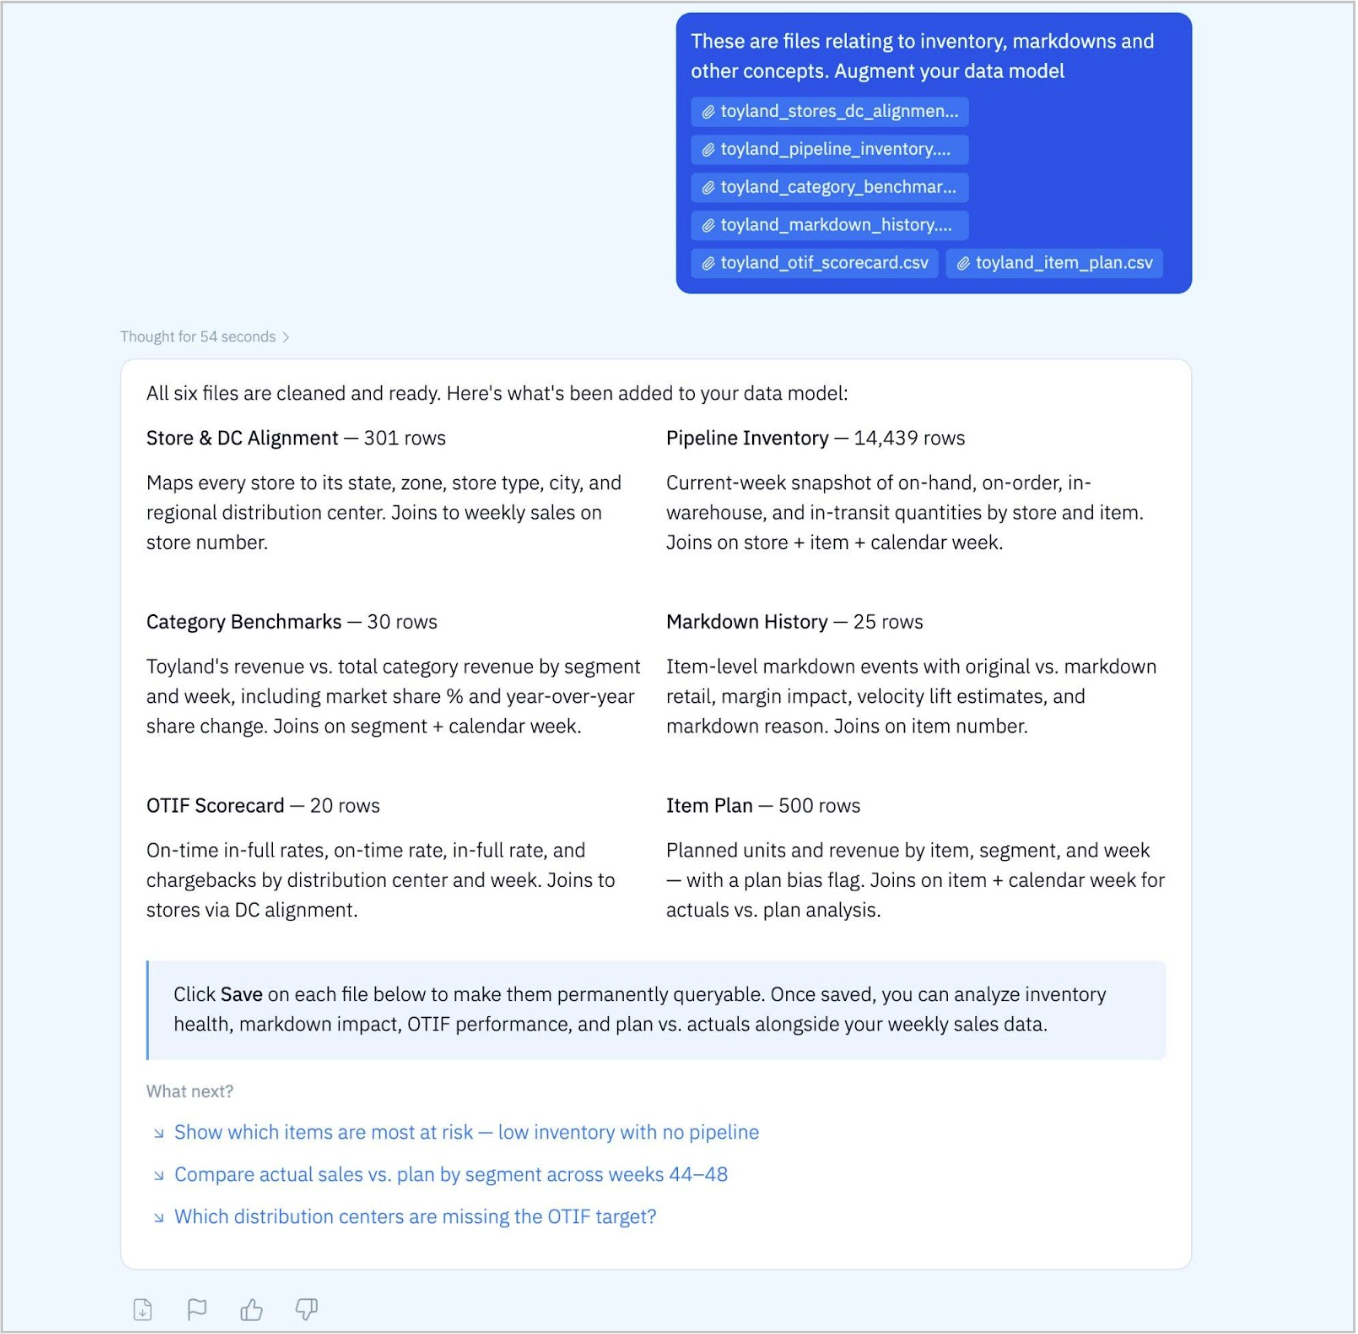
That's it. Two uploads. 73,377 rows of POS data joined across seven tables — inventory, markdowns, OTIF, plan vs. actual, and category benchmarks — ready to query in minutes.
Six questions. Answered in seconds.
We asked Iris six questions a VP of Sales would ask before any supplier review. Here's what it found — and the action each answer unlocked. Click any question to watch Iris answer it live.
| Question — click to watch | What Iris found | Action it enables |
|---|---|---|
| Where do I stand vs. plan? | Week 48 missed plan by -$5,396 (-6.5%). RC Vehicles drove 72% of the gap (-$3,860). Only Plush Essentials beat plan. | Walk in with the segment diagnosis, not just the headline number. Two specific conversations prepared. |
| Which top items are stocking out? | 14 items 100% OOS — $44,469 in estimated lost sales this week. Warehouse stock exists for most; replenishment velocity is the problem. | Call the DC before the QBR. Prioritize TOY100041/43 transfers for ~$10K recovery next week. |
| How are we growing vs. last year? | +10.9% overall. But Outdoor Play stalling at +1.3% in Wk 48 and Board Games swinging from +70% to -11% with no clear trend. | Flag the erratic segments proactively. Bring an item-level explanation rather than a positive headline. |
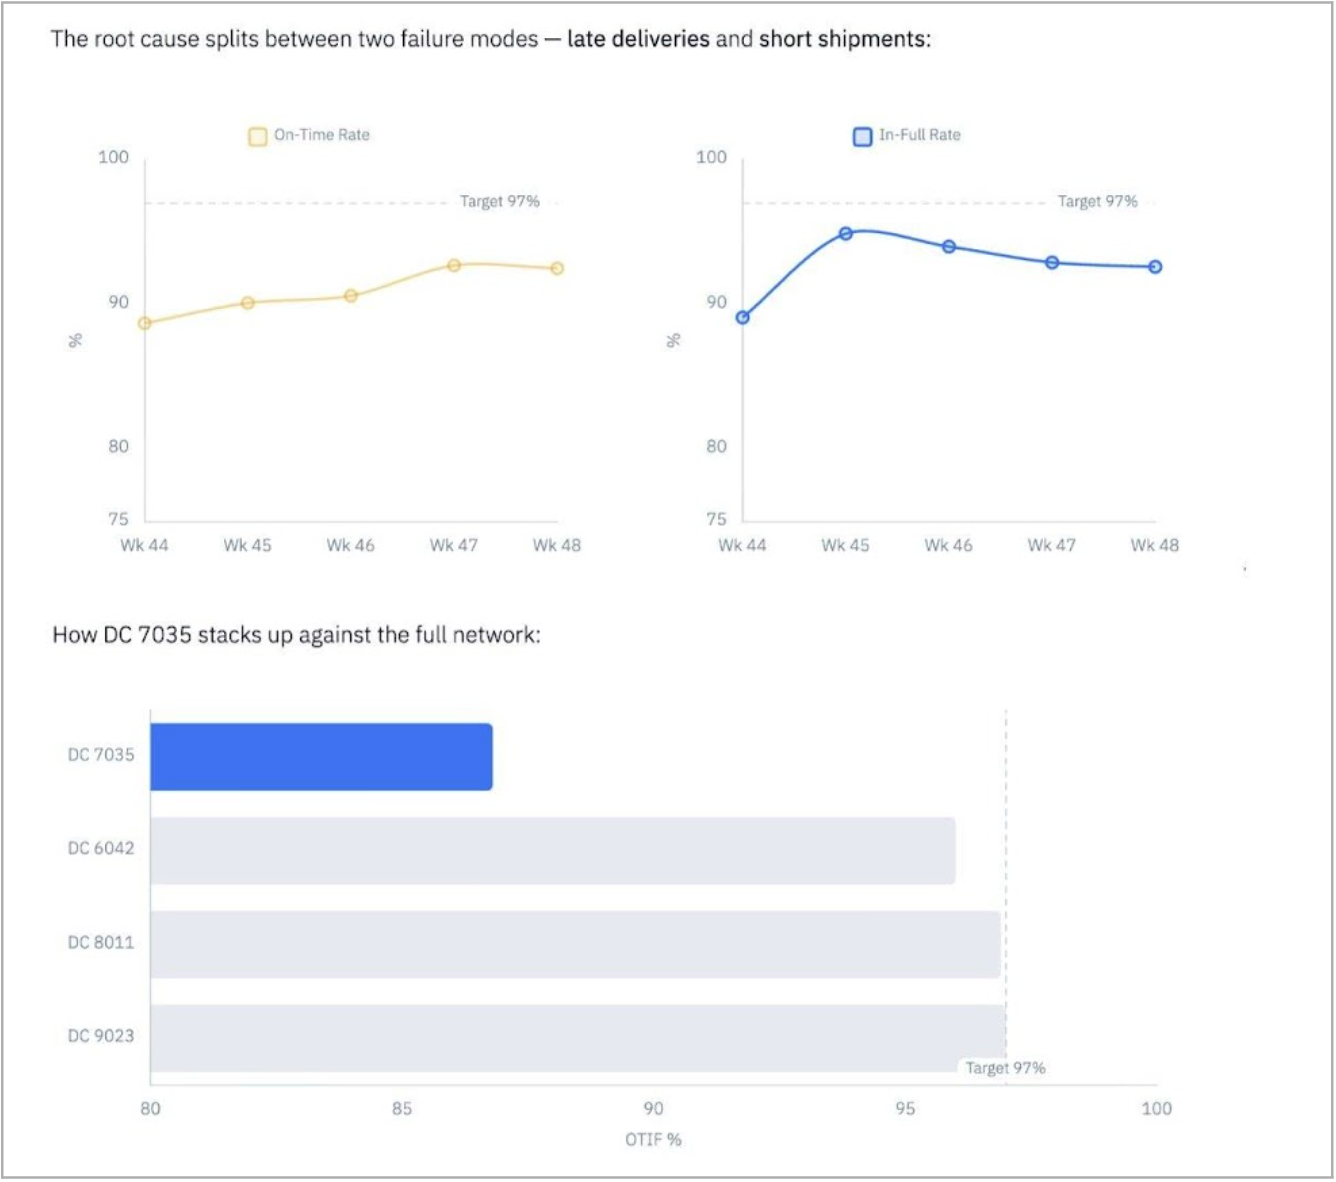
| What is DC 7035 actually costing? | 86.8% OTIF avg — 10pts below network. $6,554 in chargebacks over 5 weeks (3.8× next worst). On pace for $68K annual exposure. | Root cause is In-Full rate, not On-Time. Scope the structural fix before the next audit. |
| Which slow movers should I markdown? | 10 items at 96–327 weeks of supply, all below 80% of plan. Proactive markdowns cost ~$36K margin but deliver 1.56× avg velocity lift. | Walk in with a ranked proposal: item, markdown depth, weeks saved, margin cost. Supplier controls the negotiation. |
| Are we gaining or losing shelf share? | Overall -0.4pp vs. prior year on a $303K category. Growing in dollars but losing ground in 4 of 6 segments. Building Blocks accelerating down to -1.53pp. | RC Vehicles is the one place to press for more facings. Building Blocks share erosion is the strategic ask at the next reset. |
How the conversation changes
Without this analysis, a VP walking into the Week 48 review would have known the headline miss and not much else. With Iris, they'd know all of the following before the buyer said a word:
| Scenario | Without Iris | With Iris |
|---|---|---|
| Plan vs. Actual | Headline -6.5%; no segment breakdown | RC Vehicles driving 72% of gap — two specific conversations ready |
| Stockouts | $44K in lost sales surfaced at the meeting | Flagged mid-week; transfers prioritized; ~$10K recovery possible |
| YoY Growth | Positive headline; no trend or segment analysis | Outdoor Play and Board Games flagged for item-level drill |
| OTIF / DC 7035 | Monthly chargeback invoice as a surprise | Root cause scoped; structural fix in progress; $68K annual exposure |
| Markdowns | Buyer proposes cuts; supplier negotiates from weakness | 10 items ranked with depths, projections, and margin trade-offs |
| Category share | +10.9% growth masking -0.4pp erosion in 4 of 6 segments | RC Vehicles: press the advantage. Building Blocks: strategic ask |
Why this matters right now
Walmart's data environment is getting more transparent with Scintilla. That information advantage — historically one of the most powerful structural dynamics in the buyer-supplier relationship — is only going to compound.
The tools available on the supplier side have finally caught up. The same Scintilla and Retail Link CSV exports that have always existed in every supplier's account can now be connected to an AI layer that answers business questions in plain English — in seconds, with no new infrastructure and no analyst queue.
Walmart's data infrastructure was always world-class. The tools to match it on the supplier side are finally here. The suppliers who move first will own the relationship.
See it for yourself
Iris is available for you to try for free ! Upload your own Scintilla files and ask Iris the same 6 questions in this blog or anything else that is important to you. Go try Iris at GoIris.ai.
Appendix: The six questions in depth
Each section below shows the full Iris output for the corresponding question — insight summary, charts, and analysis. All data is from the Toyland Inc. fictional dataset.
Q1 — Where do I stand vs. plan this week?
RC Vehicles alone accounts for $3,860 of the $5,396 shortfall — nearly 72% of the total gap.
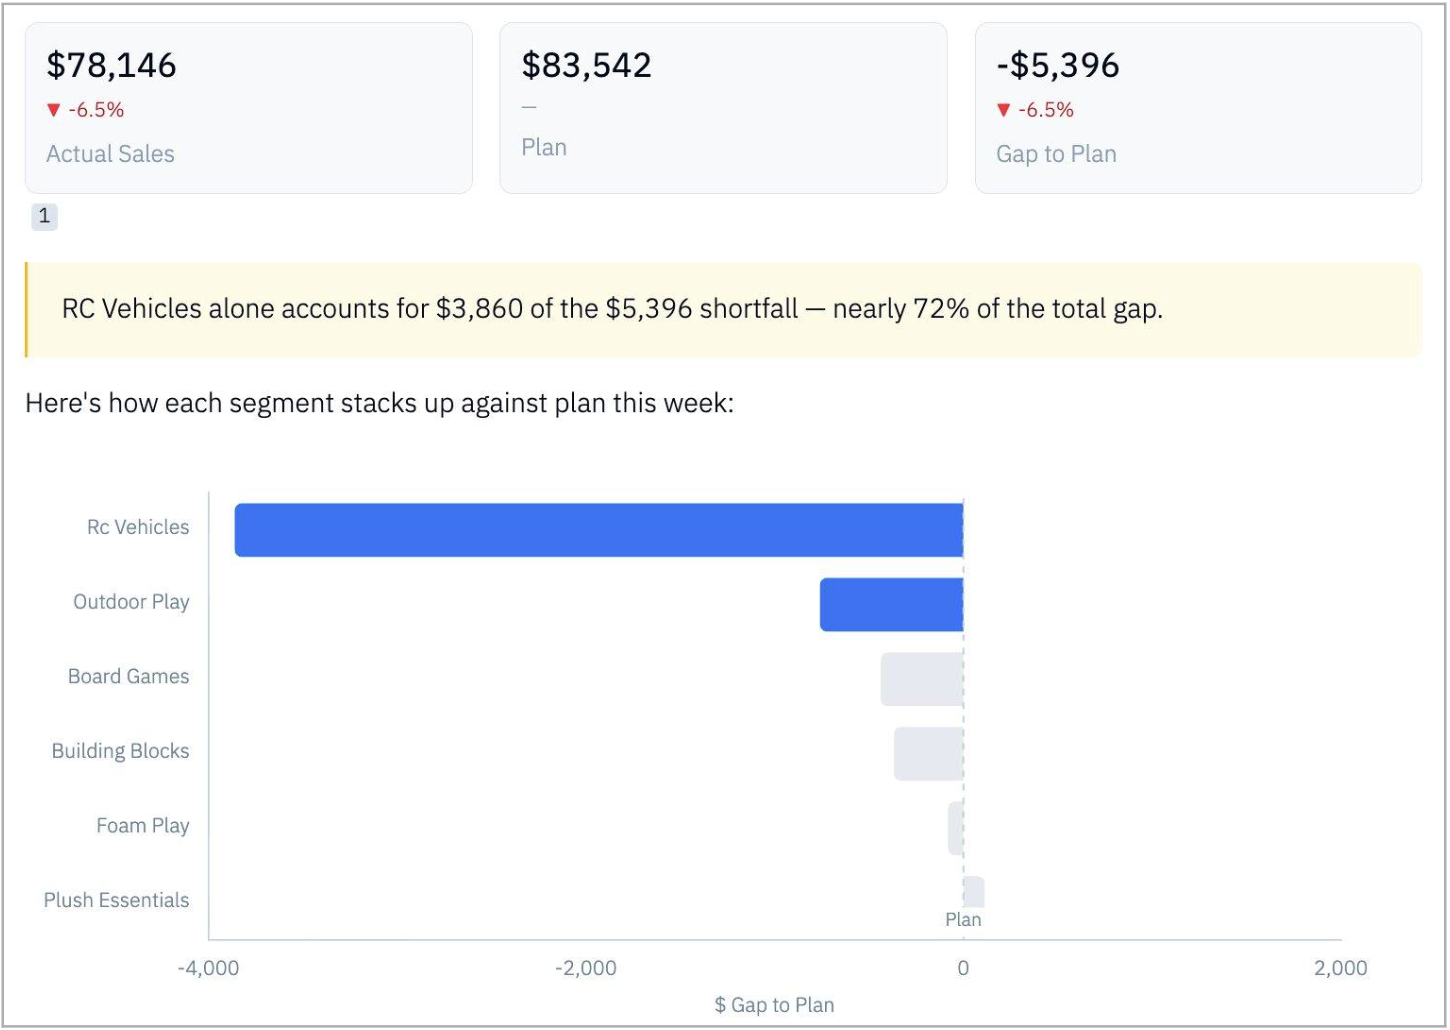
Week 48 came in at $78,146 actual vs. a plan of $83,542 — a -$5,396 (-6.5%) miss. The segment breakdown was more actionable than the headline:
- Plush Essentials — only segment beating plan: +$112 (+5.6%)
- Building Blocks — essentially inline at -$368 (-1.2%)
- Outdoor Play — down -$760 (-12.4%)
- Board Games — worst rate miss at -30.3% (-$438) — a structural signal, not a one-week anomaly
- RC Vehicles — largest absolute miss at -$3,860 (-9.1%), driving 72% of the total gap
The segment breakdown converts a one-line report-out into a specific, prepared conversation with the buyer. Without it, you're defending a number. With it, you're presenting a diagnosis.
Q2 — Which of my best-selling items are running out of stock?
14 of your top-selling items are 100% out of stock — costing an estimated $44,469 in lost sales this week alone.
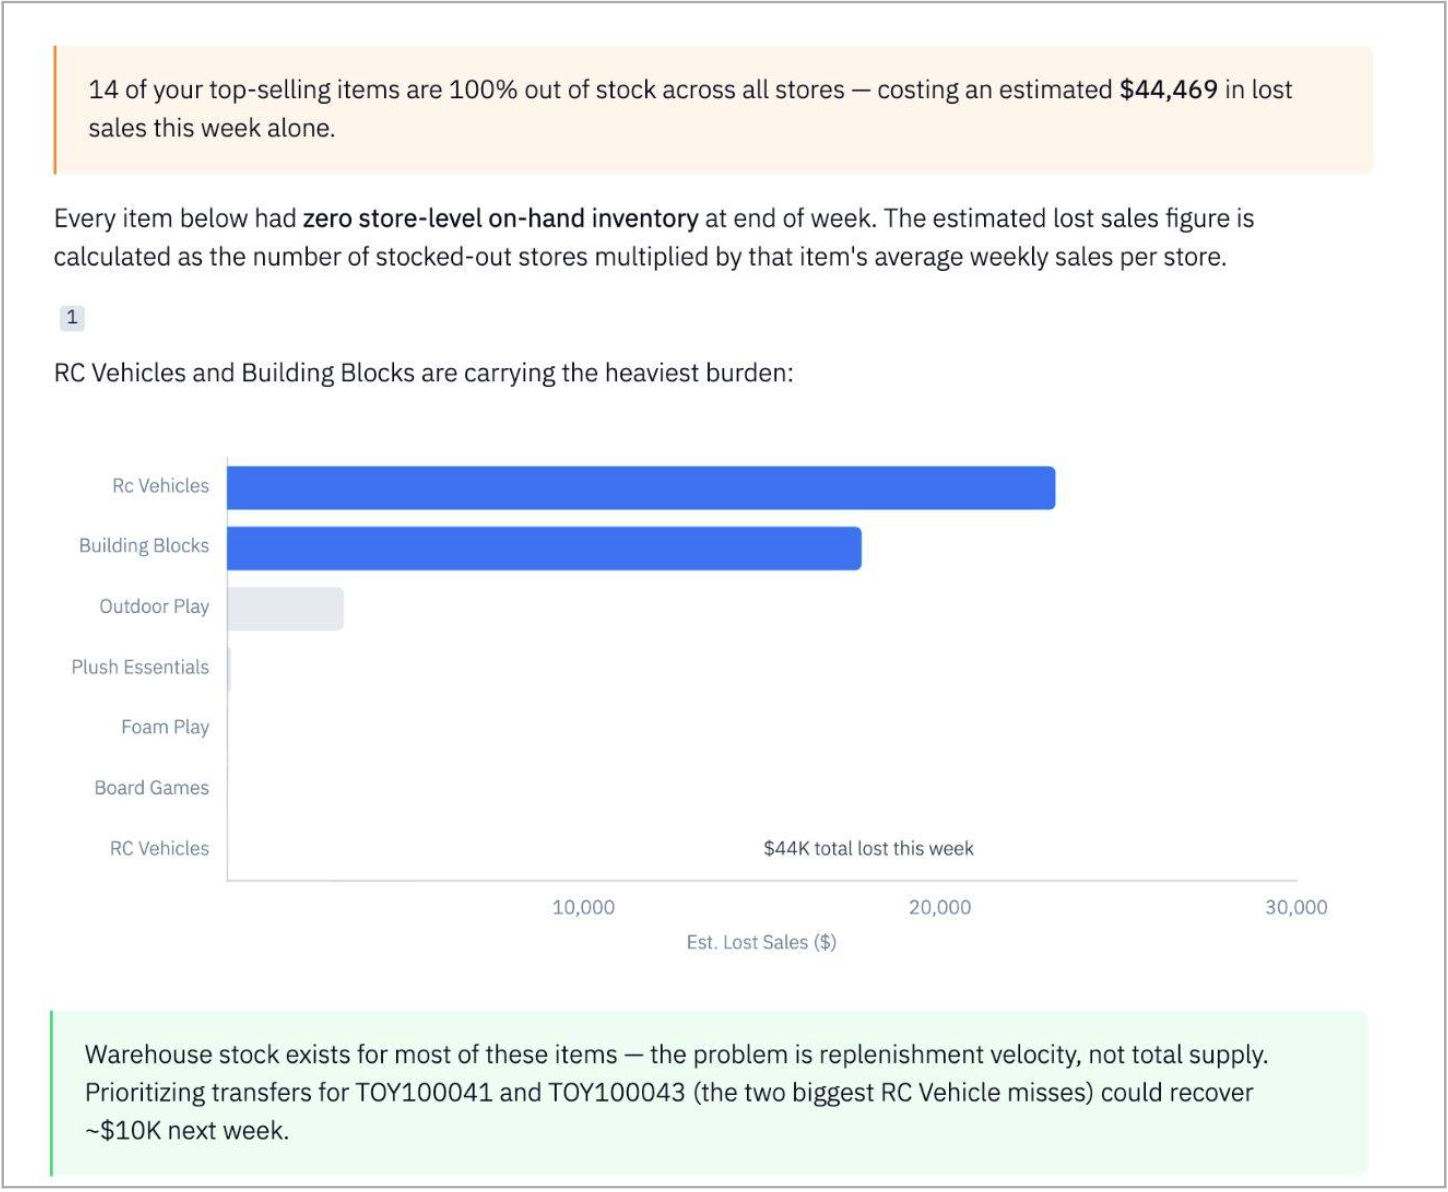
Iris identified 14 items with zero store-level on-hand inventory at the end of Week 48. Combined estimated lost sales: $44,469 in a single week. The critical nuance: warehouse stock exists for most of these items. The problem isn't total supply — it's replenishment velocity. Prioritizing transfers for TOY100041 and TOY100043 alone could recover approximately $10,000 the following week.
A standard stockout report tells you stores are empty. Iris tells you whether the problem is fixable this week — and which two items to call the DC about first.
Q3 — How are we growing vs. last year?
The business is consistently growing ahead of last year — and the gap is widening. +$9.9K ahead in Week 47 alone.
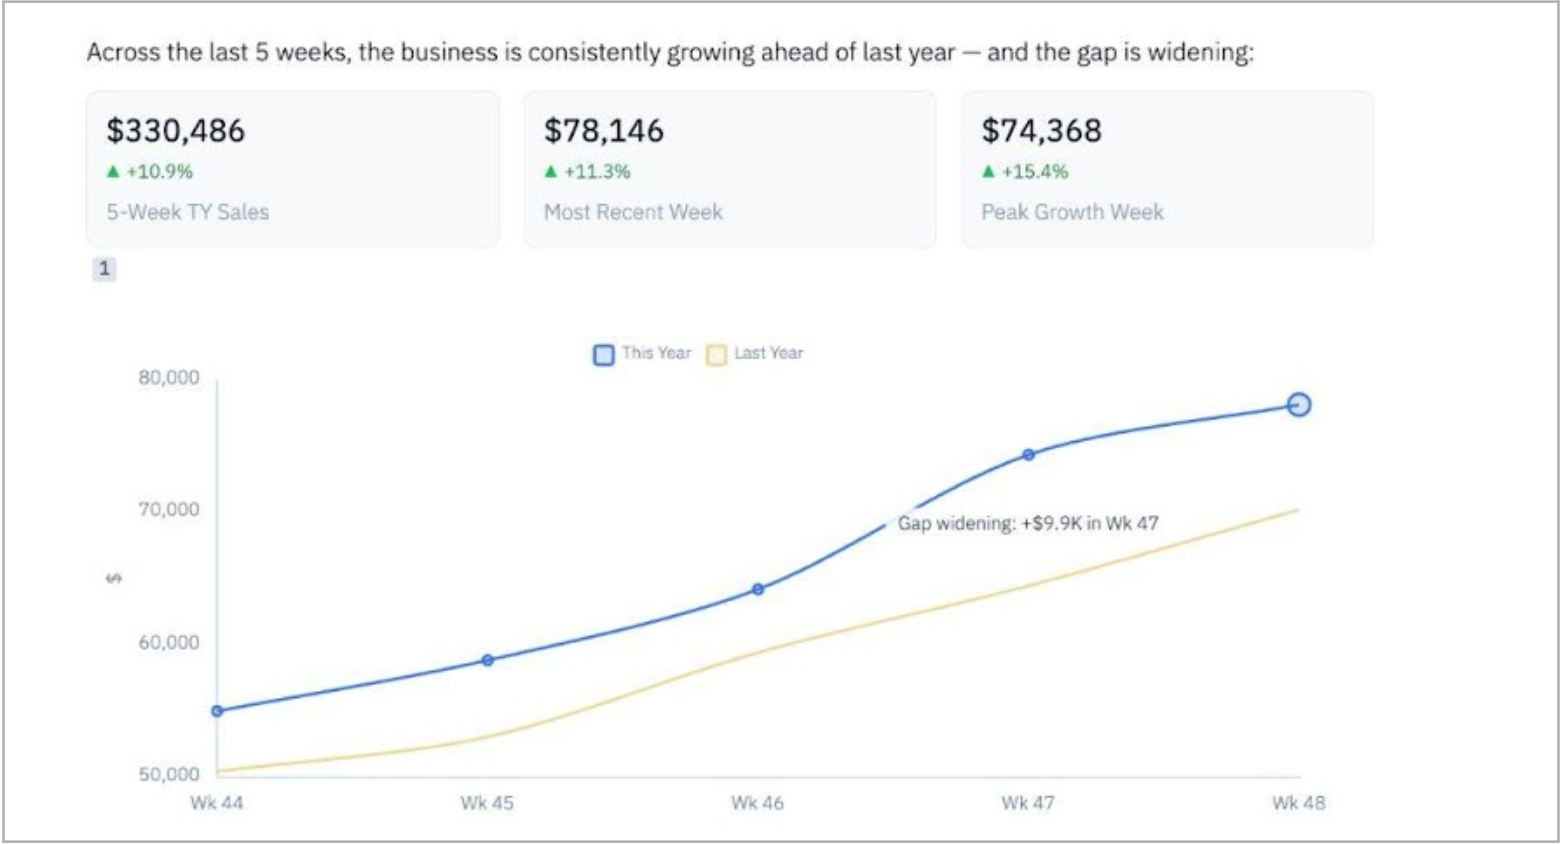
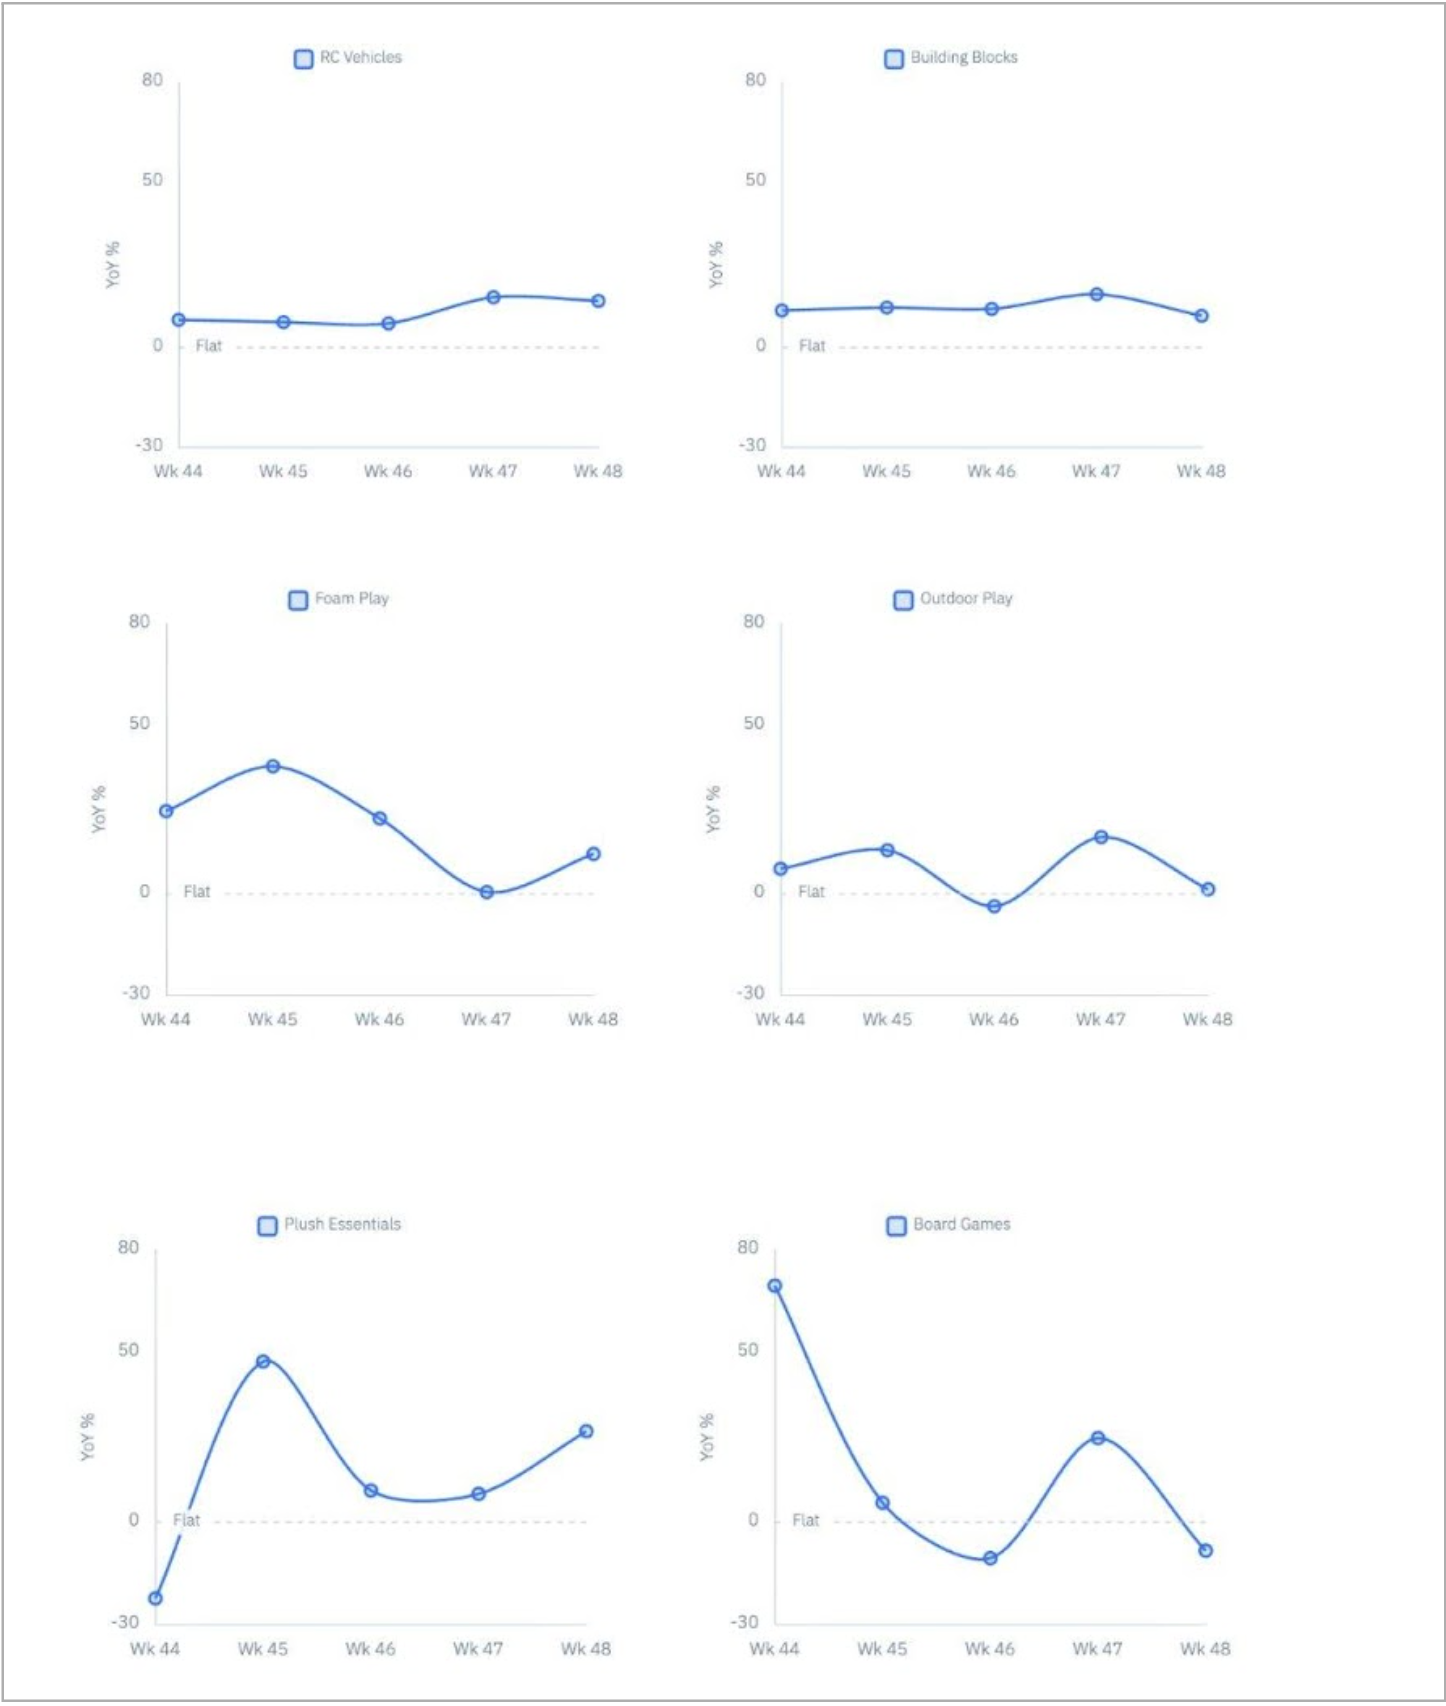
The headline: $330,486 in 5-week sales, up +10.9%. Most recent week: $78,146 (+11.3%). Peak week: $74,368 (+15.4%). But the segment picture told a more nuanced story:
- RC Vehicles — biggest dollar contributor (+$15,860 vs LY), re-accelerating in Weeks 47–48
- Building Blocks — steadiest performer at +12.1% every week
- Foam Play — fastest rate (+17.8%) but small scale; peaked at +38% in Wk 45 then cooled
- Plush Essentials — volatile but recovering: -22% in Wk 44, surged to +27% in Wk 48
- Outdoor Play — slowest grower at +6.5%; dipped negative in Wk 46, barely +1.3% in Wk 48
- Board Games — most erratic: swinging +70% to -11% week to week with no clear trend
Q4 — DC 7035 keeps getting flagged — what's it actually costing me?
DC 7035's OTIF rate is averaging 86.8% — more than 10 points below every other DC — generating $6,554 in chargebacks over 5 weeks, nearly 4× the next worst DC.
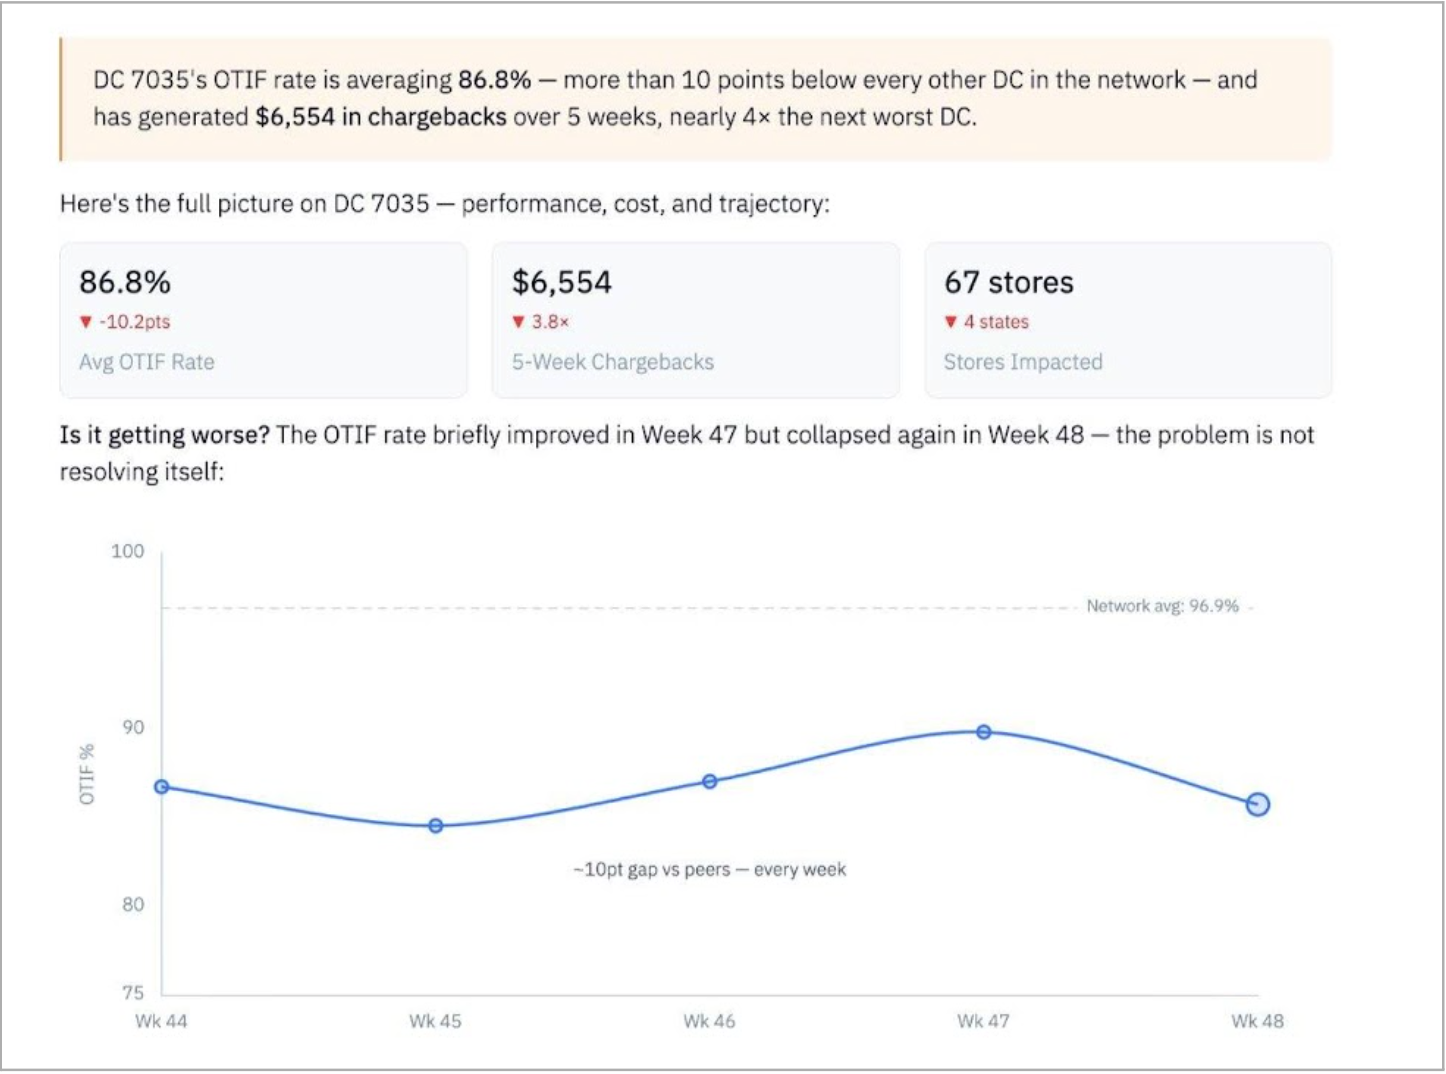
DC 7035 was a persistent and worsening problem. In a single query, Iris assembled the full picture:
- 86.8% average OTIF — 10+ points below the network average of 96.9%
- $6,554 in chargebacks over 5 weeks — 3.8× the next worst DC
- 67 stores across 4 states in the southern region
- On pace for $68K+ in annual chargebacks at the current run rate
The root cause is In-Full Rate: peaked at 94.9% in Week 45, then slid back to 92.6% — a supply accuracy or pick issue that wasn't resolving itself. The Week 47 improvement followed by Week 48 collapse was the clearest possible signal: the problem is structural, not cyclical.
Q5 — Which slow movers should I markdown before the buyer does it for me?
10 items at 96–327 weeks of supply — all below 80% of plan. Proactive markdowns cost ~$36K in margin but accelerate clearance by 1.56× on average.
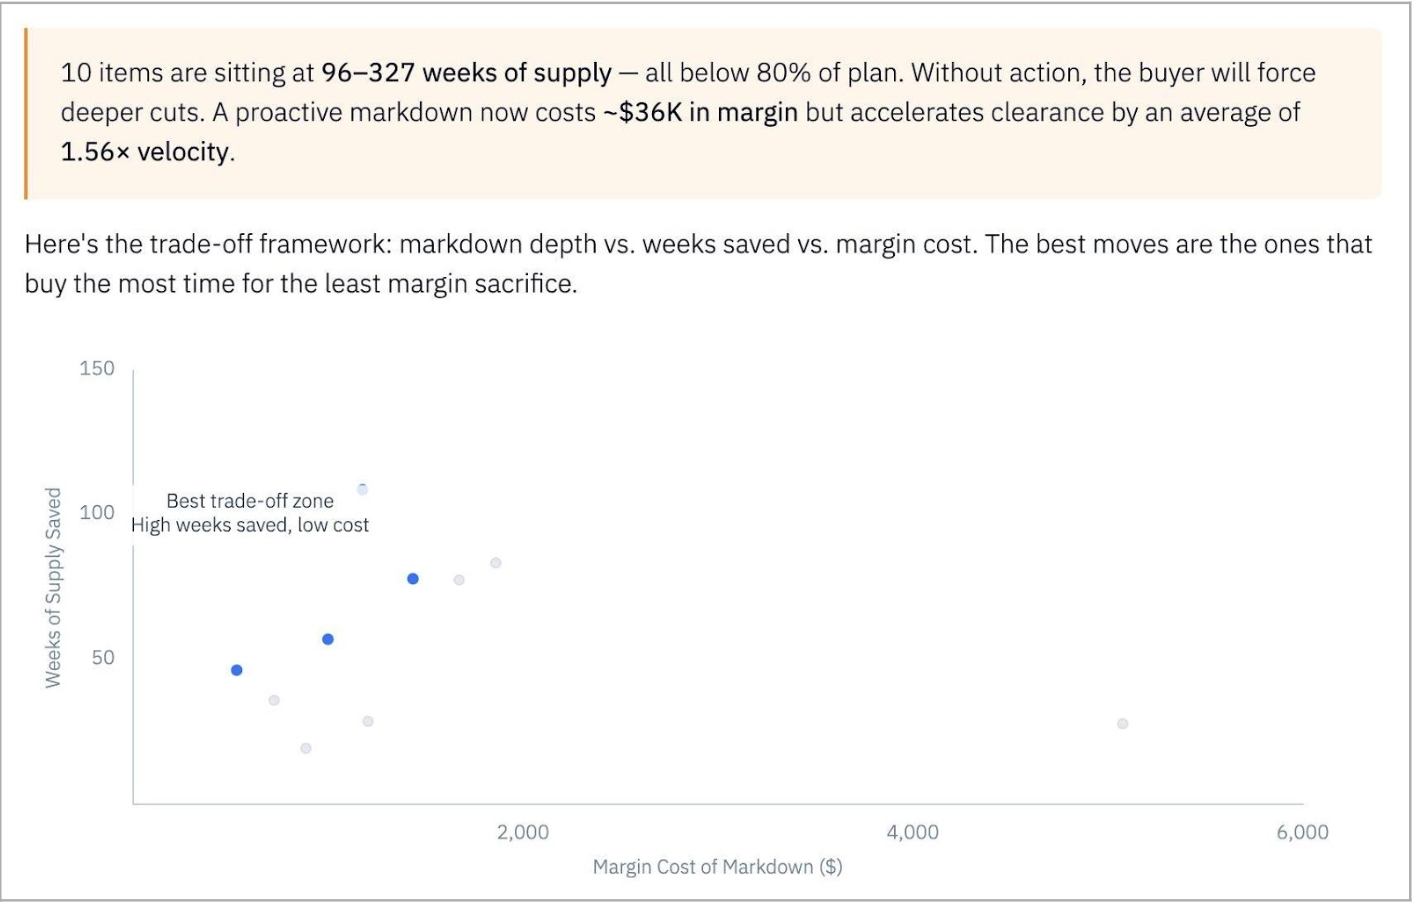
Iris ranked 10 items by inventory urgency and mapped the trade-off: weeks of supply saved vs. margin cost. The clearest priorities:
- TOY100018 (Outdoor Play) — 326.7 weeks of supply. Best efficiency: 10% markdown costs $1,176 but saves 109 weeks
- TOY100012 (RC Vehicles) — 155 weeks. Needs a 25% markdown but delivers the highest velocity lift at 2.17×. The buyer will go here anyway — better to move first
- TOY100016 (RC Vehicles) — 110 weeks. Largest margin at stake ($27,918). A 10% markdown preserves $22,842
Q6 — Are we gaining or losing shelf share against the competition?
Overall share: 25.7%, down -0.4pp vs. prior year on a $303K category. Growing in dollars — but losing ground in 4 of 6 segments.
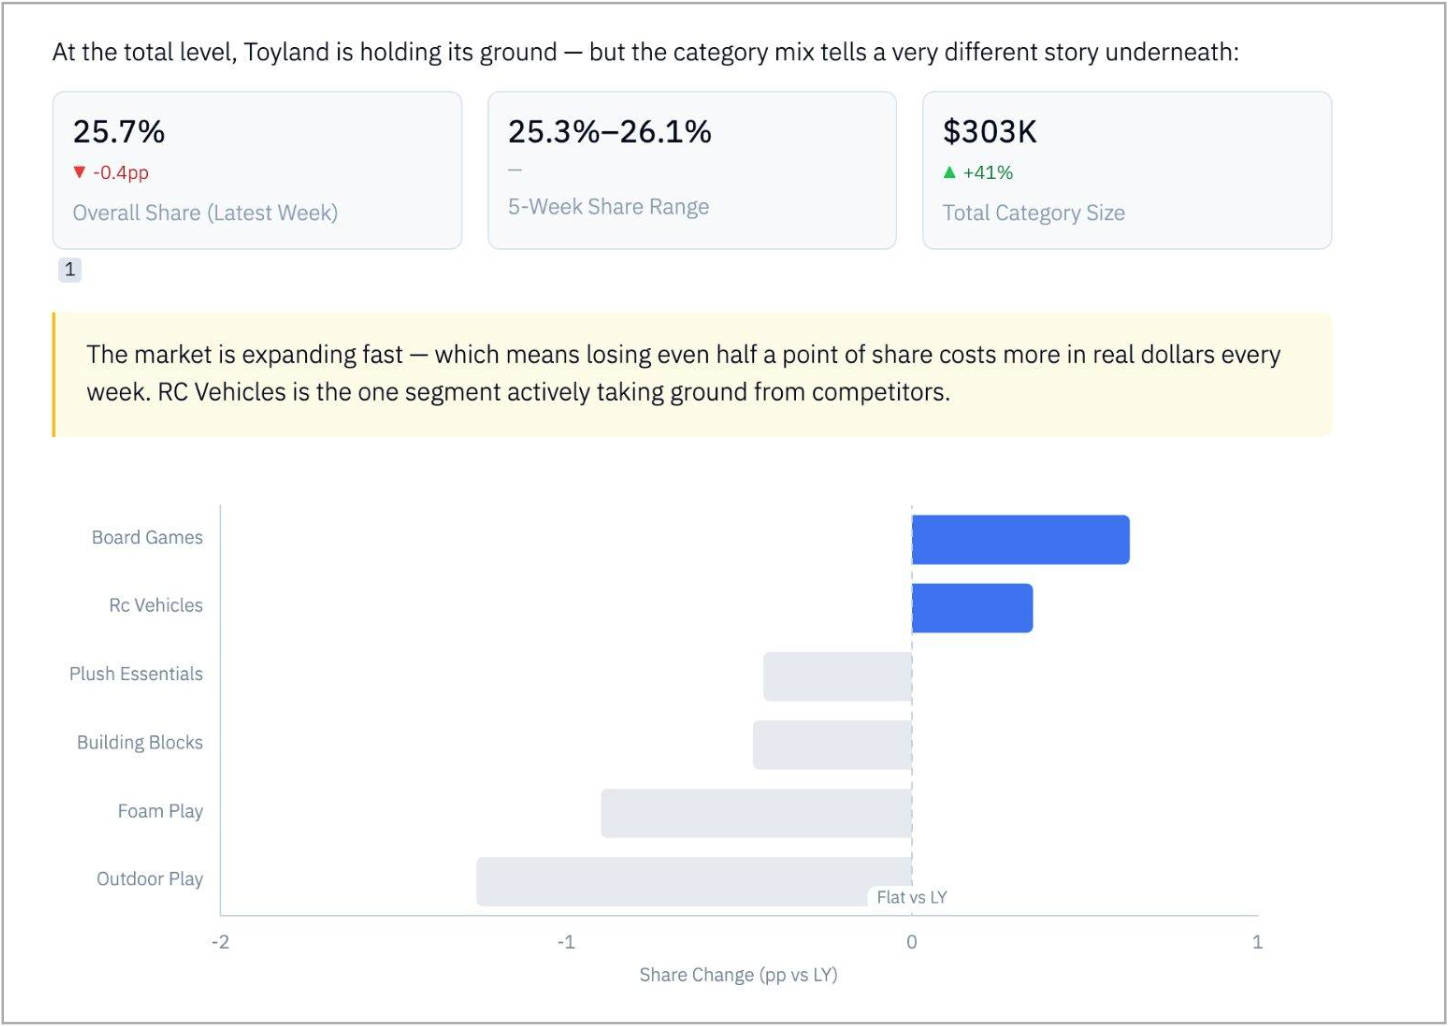
This was the most strategically important finding. Toyland was growing revenue at +10.9% while simultaneously losing overall category share (-0.4pp). The market was expanding faster. Competitors were capturing the incremental dollar. In a growing category, even a small share loss costs more in real dollars every week.
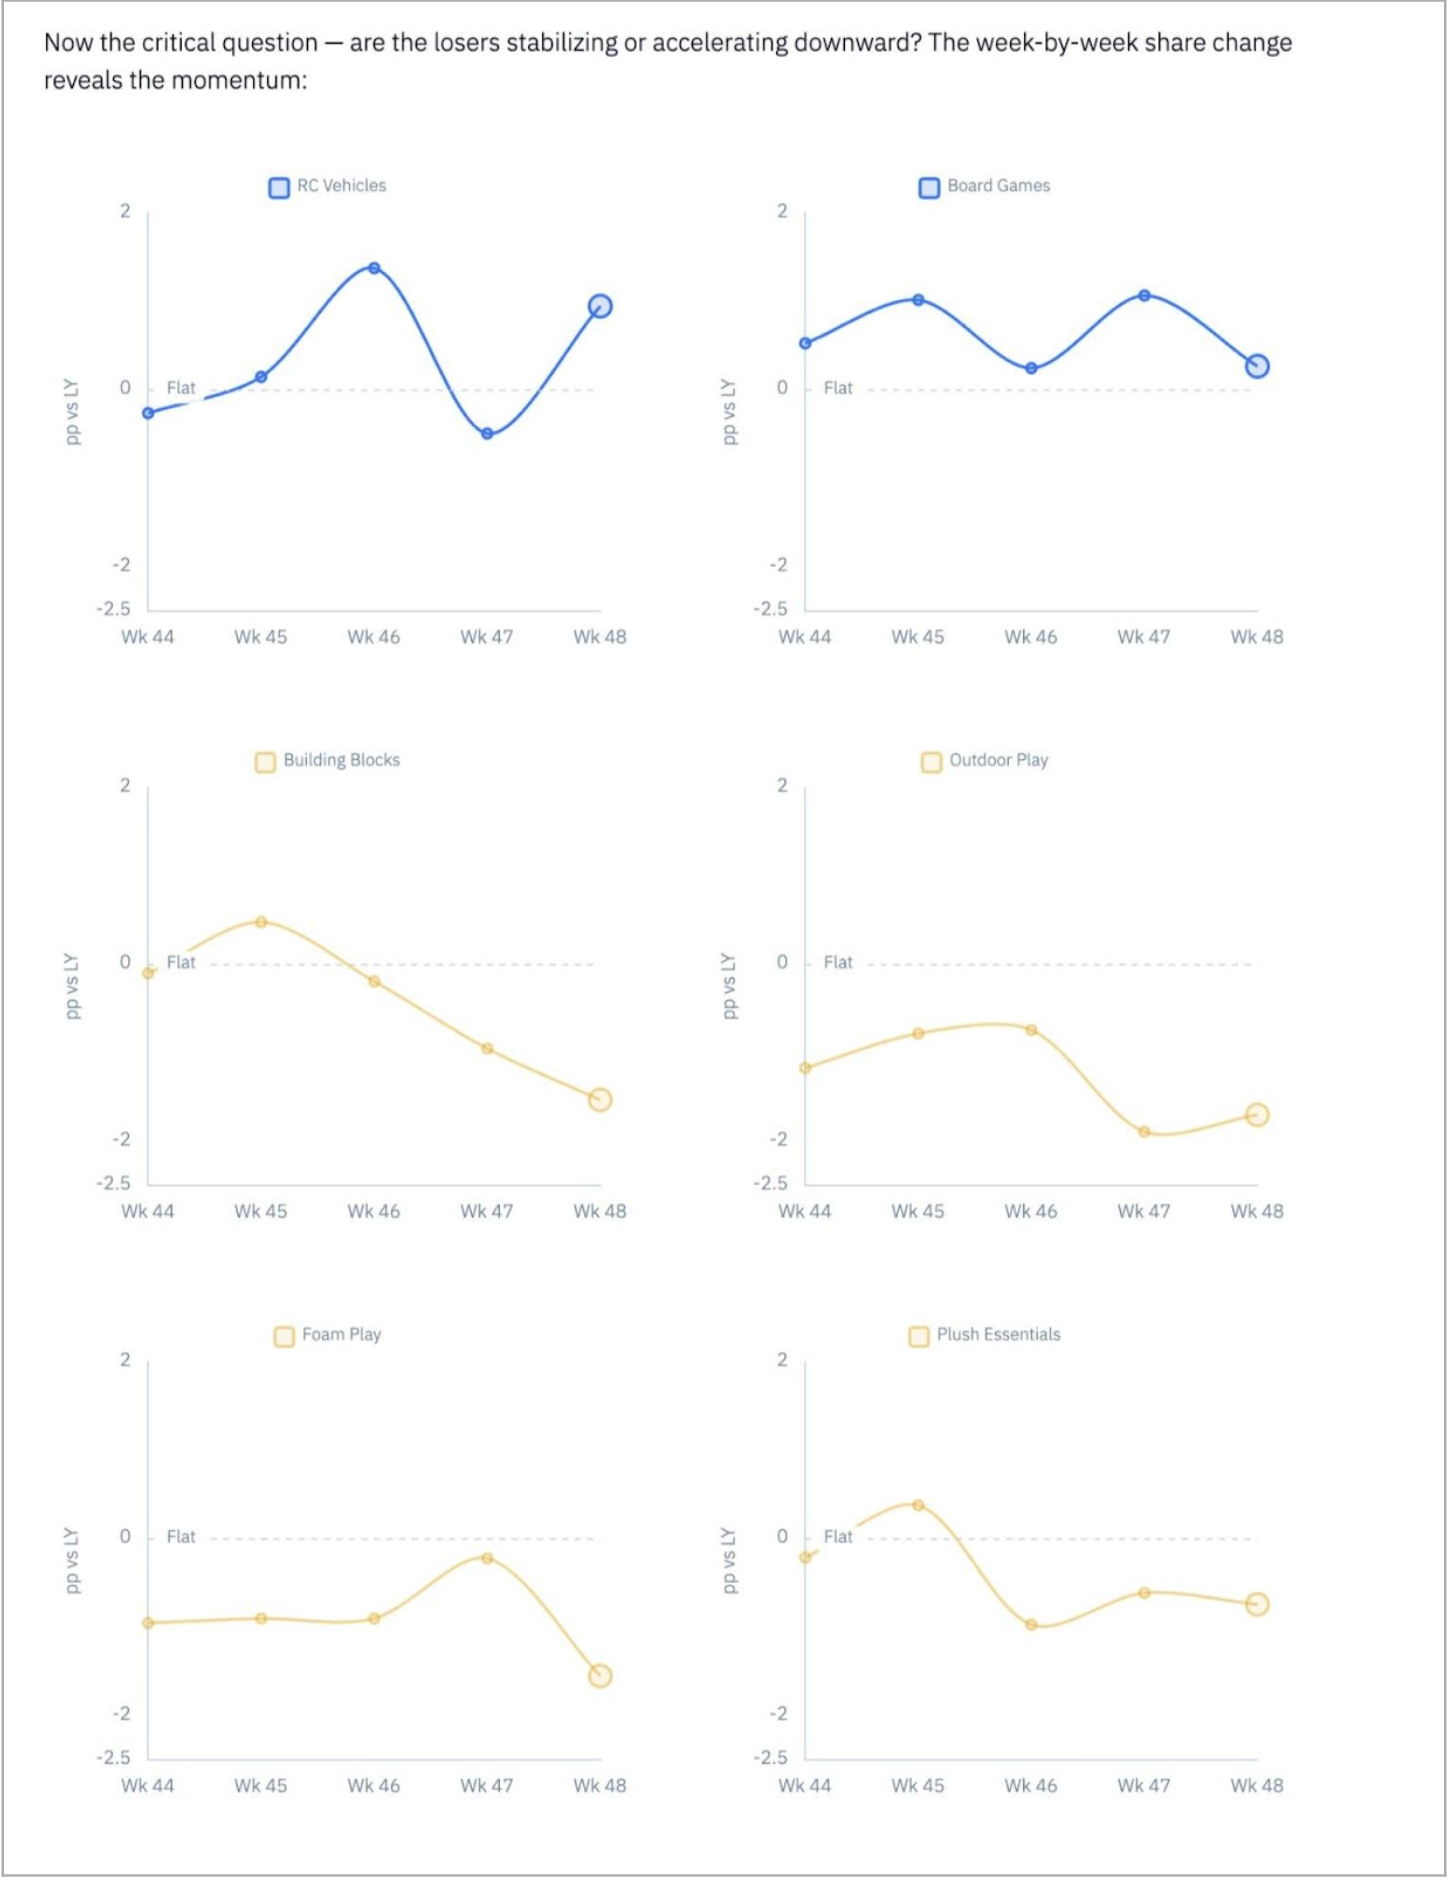
- RC Vehicles — taking share, accelerating. +0.95pp in Week 48 and improving. Press the advantage
- Board Games — gaining but fading. Positive all 5 weeks but narrowing — Wk 48 at just +0.27pp
- Building Blocks — losing share, accelerating downward. -0.10pp in Wk 44 to -1.53pp in Wk 48. Most urgent structural problem
- Outdoor Play — consistent loser. Negative every week, averaging -1.26pp
- Foam Play — quietly eroding. Spiked to -1.55pp in Wk 48
- Plush Essentials — marginal but stable. Hovering -0.4 to -0.7pp
Growing +10.9% in dollars while losing -0.4pp of category share isn't a success story — it's a warning. Iris surfaces it before the buyer does.